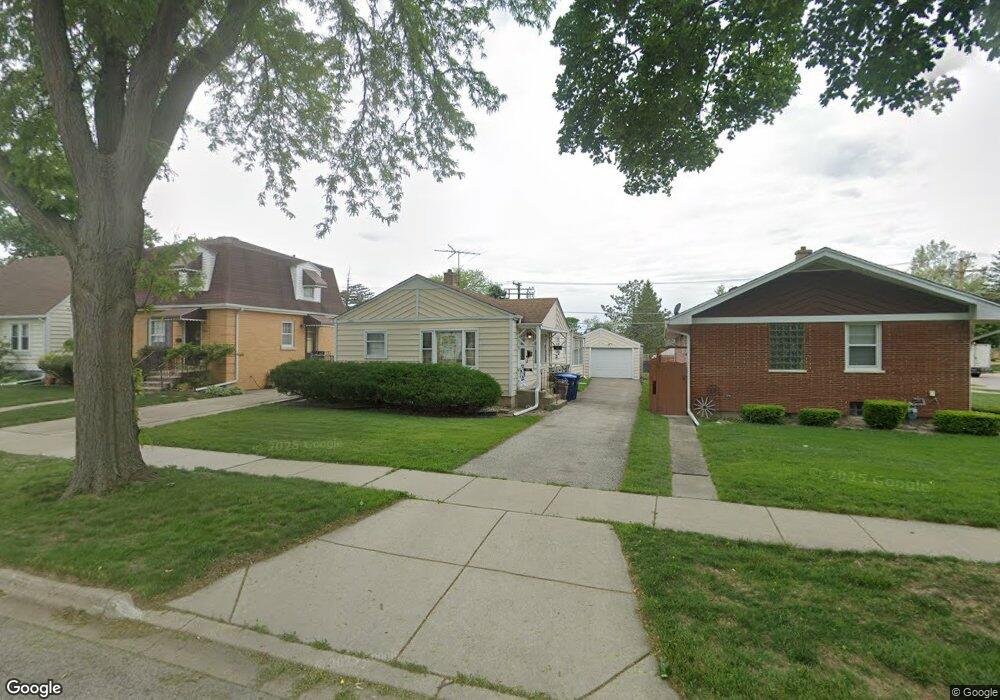
1078 Webster Ln Des Plaines, IL 60016
Estimated Value: $273,000 - $323,352
2
Beds
1
Bath
912
Sq Ft
$329/Sq Ft
Est. Value
About This Home
This home is located at 1078 Webster Ln, Des Plaines, IL 60016 and is currently estimated at $300,088, approximately $329 per square foot. 1078 Webster Ln is a home located in Cook County with nearby schools including Forest Elementary School, Algonquin Middle School, and Maine West High School.
Ownership History
Date
Name
Owned For
Owner Type
Purchase Details
Closed on
Aug 28, 2023
Sold by
Josephine A Parla Declaration Of Trust
Bought by
Cardamone Michael Thomas
Current Estimated Value
Home Financials for this Owner
Home Financials are based on the most recent Mortgage that was taken out on this home.
Original Mortgage
$208,000
Outstanding Balance
$186,371
Interest Rate
5.88%
Mortgage Type
New Conventional
Estimated Equity
$113,717
Purchase Details
Closed on
Jul 14, 2010
Sold by
Chicago Title Land Trust Company
Bought by
Declaration Parla Josephine A and Josephine A Parla Declaration Of Trust
Purchase Details
Closed on
May 21, 1997
Sold by
Parla Josephine A
Bought by
The Chicago Trust Company and Trust #1103382
Create a Home Valuation Report for This Property
The Home Valuation Report is an in-depth analysis detailing your home's value as well as a comparison with similar homes in the area
Home Values in the Area
Average Home Value in this Area
Purchase History
We collect this data history from publicly available records. To have your information removed, we recommend requesting removal directly through your county’s website.
| Date | Buyer | Sale Price | Title Company |
|---|---|---|---|
| Cardamone Michael Thomas | $260,000 | Old Republic Title | |
| Declaration Parla Josephine A | -- | Chicago Title Land Trust Co | |
| The Chicago Trust Company | -- | -- |
Source: Public Records
Mortgage History
We collect this data history from publicly available records. To have your information removed, we recommend requesting removal directly through your county’s website.
| Date | Status | Borrower | Loan Amount |
|---|---|---|---|
| Open | Cardamone Michael Thomas | $208,000 |
Source: Public Records
Tax History
| Year | Tax Paid | Tax Assessment Tax Assessment Total Assessment is a certain percentage of the fair market value that is determined by local assessors to be the total taxable value of land and additions on the property. | Land | Improvement |
|---|---|---|---|---|
| 2025 | $4,822 | $24,000 | $5,346 | $18,654 |
| 2024 | $4,822 | $24,257 | $4,455 | $19,802 |
| 2023 | $581 | $24,257 | $4,455 | $19,802 |
| 2022 | $581 | $24,257 | $4,455 | $19,802 |
| 2021 | $676 | $17,857 | $3,564 | $14,293 |
| 2020 | $619 | $17,857 | $3,564 | $14,293 |
| 2019 | $610 | $19,842 | $3,564 | $16,278 |
| 2018 | $679 | $19,473 | $3,118 | $16,355 |
| 2017 | $3,936 | $19,473 | $3,118 | $16,355 |
| 2016 | $1,250 | $19,473 | $3,118 | $16,355 |
| 2015 | $1,428 | $18,138 | $2,673 | $15,465 |
| 2014 | $1,369 | $18,138 | $2,673 | $15,465 |
| 2013 | $1,366 | $18,138 | $2,673 | $15,465 |
Source: Public Records
Map
Nearby Homes
- 1076 S 3rd Ave
- 1052 Margret St
- 1117 Margret St
- 1023 Margret St
- 1304 Dennis Place
- 1152 E Walnut Ave
- 35 Nicholas Dr W
- 980 W Grant Dr
- 940 W Grant Dr
- 870 E Thacker St
- 840 E Thacker St
- 1205 S Wolf Rd
- 963 E Prairie Ave
- 1458 Kingston Ct
- 1325 E Walnut Ave
- 1042 Alfini Dr
- 900 Lee St Unit 202
- 1030 Bogart St
- 946 Walter Ave
- 1080 Bogart St
- 1086 Webster Ln
- 941 E Walnut Ave
- 1090 Webster Ln
- 1098 Webster Ln
- 1085 S 3rd Ave
- 1081 S 3rd Ave
- 1093 S 3rd Ave
- 1106 Webster Ln
- 940 E Walnut Ave
- 1101 S 3rd Ave
- 1075 Webster Ln
- 1083 Webster Ln
- 957 E Walnut Ave
- 1089 Webster Ln
- 1114 Webster Ln
- 1107 S 3rd Ave
- 1061 S 3rd Ave
- 1095 Webster Ln
- 1054 Webster Ln
- 1103 Webster Ln
Your Personal Tour Guide
Ask me questions while you tour the home.