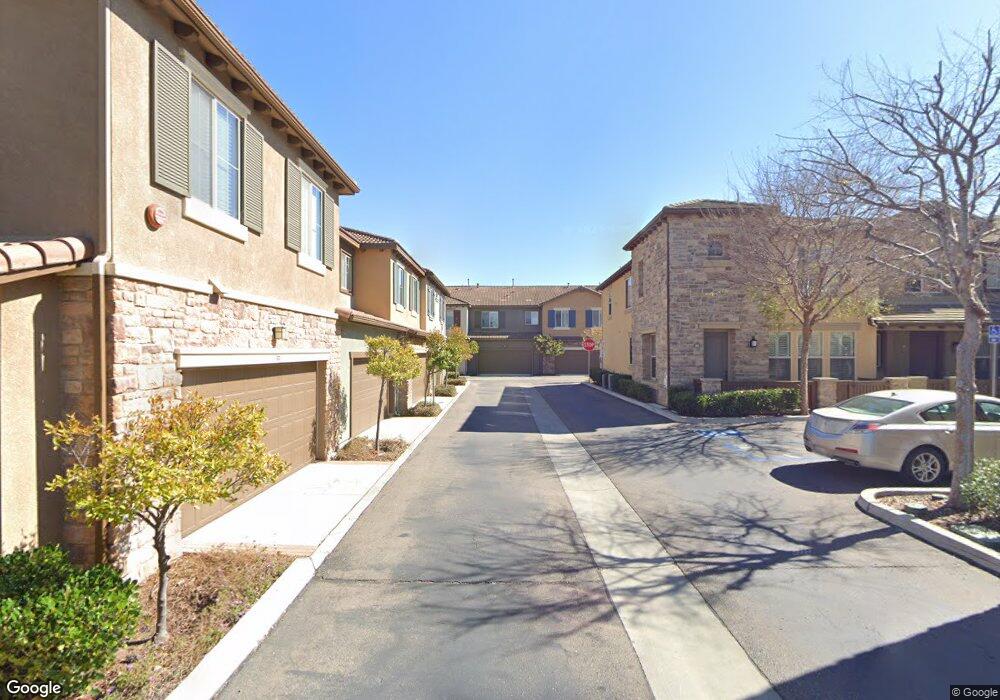
10787 Carmel Glen Unit 58 San Diego, CA 92130
Carmel Valley NeighborhoodEstimated Value: $1,249,000 - $1,627,000
4
Beds
3
Baths
2,069
Sq Ft
$702/Sq Ft
Est. Value
About This Home
This home is located at 10787 Carmel Glen Unit 58, San Diego, CA 92130 and is currently estimated at $1,452,357, approximately $701 per square foot. 10787 Carmel Glen Unit 58 is a home located in San Diego County with nearby schools including Sage Canyon School, Carmel Valley Middle School, and Torrey Pines High School.
Ownership History
Date
Name
Owned For
Owner Type
Purchase Details
Closed on
Jan 4, 2022
Sold by
Dang and Hui
Bought by
Xu And Dang Family Trust
Current Estimated Value
Home Financials for this Owner
Home Financials are based on the most recent Mortgage that was taken out on this home.
Original Mortgage
$879,000
Outstanding Balance
$810,214
Interest Rate
3.12%
Mortgage Type
New Conventional
Estimated Equity
$642,143
Purchase Details
Closed on
Jul 16, 2021
Sold by
Dang Xitong and Xu Hui
Bought by
Xu Hui and Dang Xtiong
Purchase Details
Closed on
Nov 17, 2010
Sold by
Pardee Homes
Bought by
Dang Xitong and Xu Hui
Home Financials for this Owner
Home Financials are based on the most recent Mortgage that was taken out on this home.
Original Mortgage
$318,100
Interest Rate
4.23%
Mortgage Type
New Conventional
Create a Home Valuation Report for This Property
The Home Valuation Report is an in-depth analysis detailing your home's value as well as a comparison with similar homes in the area
Home Values in the Area
Average Home Value in this Area
Purchase History
| Date | Buyer | Sale Price | Title Company |
|---|---|---|---|
| Xu And Dang Family Trust | -- | Accommodation/Courtesy Recordi | |
| Dang Xitong | -- | Western Resources | |
| Xu Hui | -- | None Available | |
| Dang Xitong | $618,500 | First American Title Insuran |
Source: Public Records
Mortgage History
| Date | Status | Borrower | Loan Amount |
|---|---|---|---|
| Open | Dang Xitong | $879,000 | |
| Previous Owner | Dang Xitong | $318,100 |
Source: Public Records
Tax History Compared to Growth
Tax History
| Year | Tax Paid | Tax Assessment Tax Assessment Total Assessment is a certain percentage of the fair market value that is determined by local assessors to be the total taxable value of land and additions on the property. | Land | Improvement |
|---|---|---|---|---|
| 2025 | $9,270 | $791,881 | $448,404 | $343,477 |
| 2024 | $9,270 | $776,355 | $439,612 | $336,743 |
| 2023 | $9,229 | $761,134 | $430,993 | $330,141 |
| 2022 | $9,099 | $746,211 | $422,543 | $323,668 |
| 2021 | $8,805 | $731,580 | $414,258 | $317,322 |
| 2020 | $8,830 | $724,080 | $410,011 | $314,069 |
| 2019 | $8,677 | $709,883 | $401,972 | $307,911 |
| 2018 | $8,342 | $695,965 | $394,091 | $301,874 |
| 2017 | $8,204 | $682,319 | $386,364 | $295,955 |
| 2016 | $7,963 | $668,941 | $378,789 | $290,152 |
| 2015 | $7,859 | $658,894 | $373,100 | $285,794 |
| 2014 | $7,697 | $645,988 | $365,792 | $280,196 |
Source: Public Records
Map
Nearby Homes
- 10794 Spur Point Ct
- 5398 Shannon Ridge Ln
- 10941 Derrydown Way Unit 10
- 5255 Greenwillow Ln
- 10553 Gaylemont Ln Unit 5
- 0 Grand Del Mar Place Unit VU 8-4-5 NDP2502279
- 5171 Del Mar Mesa Rd
- 6286 Belmont Trail Ct
- 6370 Carmel View S
- 5049 Ruette de Mer
- 5970 Shaw Lopez Row
- 11649 Thistle Hill Place
- 12722 Sandy Crest Ct
- 12436 Cavallo St
- 12518 Cavallo St
- 4289 Calle Isabelino
- 11325 Carmel Creek Rd
- 6718 Indio Way
- 3975 San Gregorio Way
- 11265 Caminito Aclara
- 10787 Carmel Glen Unit 62
- 10788 Carmel Glen Unit 64
- 10787 Carmel Glen
- 10689 New Grove Unit 71
- 10787 Carmel Glen Unit 59
- 10788 Carmel Glen Unit 68
- 10776 Carmel Glen
- 10776 Carmel Glen Unit 55
- 10689 New Grove Unit 69
- 10776 Carmel Glen Unit 57
- 10776 Carmel Glen Trail Unit 55
- 10776 Carmel Glen Trail Unit 56
- 10776 Carmel Glen Unit 54
- 10689 New Grove Unit 71
- 10776 Carmel Gln #57
- 10776 Carmel Glen Unit 53
- 10788 Carmel Glen Trail Unit 65
- 10650 Canyon Grove
- 10650 Canyon Grove Unit 16
- 10680 Canyon Grove Trail Unit 29