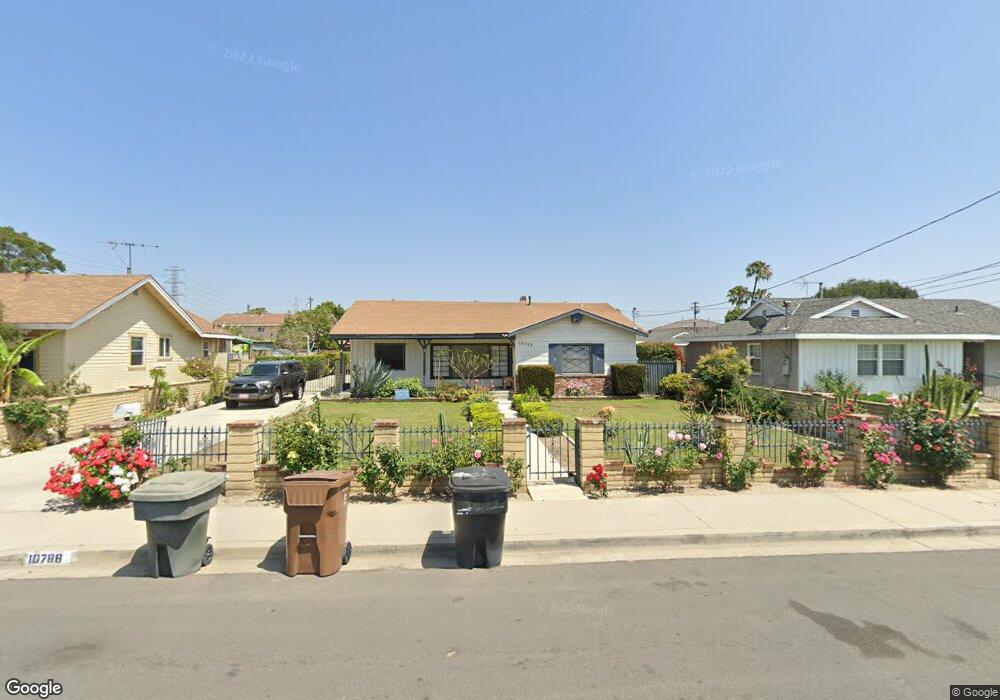
10788 Berry Ave Anaheim, CA 92804
West Anaheim NeighborhoodEstimated Value: $923,000 - $1,038,790
3
Beds
2
Baths
1,816
Sq Ft
$550/Sq Ft
Est. Value
About This Home
This home is located at 10788 Berry Ave, Anaheim, CA 92804 and is currently estimated at $999,198, approximately $550 per square foot. 10788 Berry Ave is a home located in Orange County with nearby schools including Esther L. Walter Elementary School, Dale Jr High School, and Magnolia High.
Ownership History
Date
Name
Owned For
Owner Type
Purchase Details
Closed on
Nov 11, 2020
Sold by
Menchaca Jane A and Menchaca Jane
Bought by
Jane A Menchaca Separate Property Revocable T and Menchaca
Current Estimated Value
Purchase Details
Closed on
Sep 6, 2006
Sold by
Menchaca Jane and Menchaca Daniel
Bought by
Menchaca Jane
Home Financials for this Owner
Home Financials are based on the most recent Mortgage that was taken out on this home.
Original Mortgage
$300,005
Interest Rate
6.65%
Mortgage Type
Purchase Money Mortgage
Purchase Details
Closed on
Apr 2, 2002
Sold by
Alba Daniel J
Bought by
Alba Jane A
Purchase Details
Closed on
Oct 20, 1993
Sold by
Alba Jane A
Bought by
Alba Daniel J and Alba Jane A
Home Financials for this Owner
Home Financials are based on the most recent Mortgage that was taken out on this home.
Original Mortgage
$75,000
Interest Rate
6.74%
Create a Home Valuation Report for This Property
The Home Valuation Report is an in-depth analysis detailing your home's value as well as a comparison with similar homes in the area
Home Values in the Area
Average Home Value in this Area
Purchase History
| Date | Buyer | Sale Price | Title Company |
|---|---|---|---|
| Jane A Menchaca Separate Property Revocable T | -- | New Title Company Name | |
| Menchaca Jane | -- | Alliance Title Company | |
| Alba Jane A | -- | -- | |
| Alba Daniel J | -- | Gateway Title Company |
Source: Public Records
Mortgage History
| Date | Status | Borrower | Loan Amount |
|---|---|---|---|
| Previous Owner | Menchaca Jane | $300,005 | |
| Previous Owner | Alba Daniel J | $75,000 |
Source: Public Records
Tax History Compared to Growth
Tax History
| Year | Tax Paid | Tax Assessment Tax Assessment Total Assessment is a certain percentage of the fair market value that is determined by local assessors to be the total taxable value of land and additions on the property. | Land | Improvement |
|---|---|---|---|---|
| 2025 | $2,799 | $212,038 | $23,796 | $188,242 |
| 2024 | $2,799 | $207,881 | $23,330 | $184,551 |
| 2023 | $2,717 | $203,805 | $22,872 | $180,933 |
| 2022 | $2,671 | $199,809 | $22,423 | $177,386 |
| 2021 | $2,659 | $195,892 | $21,984 | $173,908 |
| 2020 | $2,580 | $193,884 | $21,759 | $172,125 |
| 2019 | $2,534 | $190,083 | $21,333 | $168,750 |
| 2018 | $2,524 | $186,356 | $20,914 | $165,442 |
| 2017 | $2,425 | $182,702 | $20,503 | $162,199 |
| 2016 | $2,437 | $179,120 | $20,101 | $159,019 |
| 2015 | $2,725 | $176,430 | $19,799 | $156,631 |
| 2014 | $2,649 | $172,974 | $19,411 | $153,563 |
Source: Public Records
Map
Nearby Homes
- 90093 Stacie Ln
- 9155 Pacific Ave Unit 265
- 9041 Stacie Ln Unit 12
- 9272 Cerritos Ave
- 9592 Katella Ave
- 8971 Poinsettia Ln
- 11172 Homeway Dr
- 2631 W Cerritos Ave
- 11222 Magnolia St
- 2533 W Chanticleer Rd
- 9552 Dewey Dr
- 9262 Joyzelle Dr
- 8681 Katella Ave
- 8681 Katella Ave Unit 897
- 8681 Katella Ave Unit 914
- 8681 Katella Ave Unit 861
- 9762 Gamble Ave
- 10301 Rhiems Rd
- 1765 S Biscayne Ct
- 10800 Dale Ave Unit 129
- 10802 Berry Ave
- 10786 Berry Ave
- 10791 Garza Ave Unit 1
- 10791 Garza Ave
- 10822 Berry Ave
- 10762 Berry Ave
- 10801 Garza Ave
- 10781 Garza Ave
- 10756 Berry Ave
- 10823 Garza Ave
- 10791 Berry Ave
- 10771 Garza Ave
- 10781 Berry Ave
- 10801 Berry Ave
- 10752 Berry Ave
- 10795 Garza Ave Unit 2
- 10821 Garza Ave
- 10761 Berry Ave
- 10821 Berry Ave
- 10751 Garza Ave