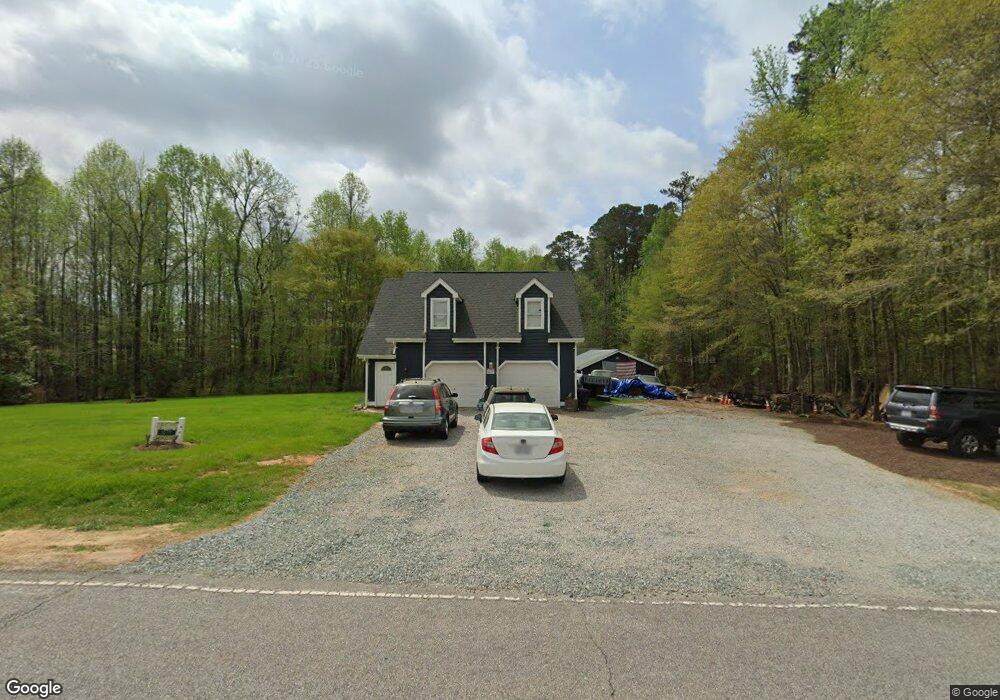
1079 Page Rd Raleigh, NC 27603
Cleveland NeighborhoodEstimated Value: $216,000 - $334,000
1
Bed
2
Baths
752
Sq Ft
$382/Sq Ft
Est. Value
About This Home
This home is located at 1079 Page Rd, Raleigh, NC 27603 and is currently estimated at $287,490, approximately $382 per square foot. 1079 Page Rd is a home located in Johnston County with nearby schools including West View Elementary School, Cleveland Middle School, and West Johnston High School.
Ownership History
Date
Name
Owned For
Owner Type
Purchase Details
Closed on
Sep 16, 2019
Sold by
Mangum Adam M and Mangum Krista Michelle
Bought by
Ford Michael Anthony and Ford Kelly
Current Estimated Value
Home Financials for this Owner
Home Financials are based on the most recent Mortgage that was taken out on this home.
Original Mortgage
$101,000
Outstanding Balance
$88,286
Interest Rate
3.5%
Mortgage Type
New Conventional
Estimated Equity
$199,204
Purchase Details
Closed on
Jul 26, 2013
Sold by
Ford William B and Ford Donna
Bought by
Mangum Adam M
Home Financials for this Owner
Home Financials are based on the most recent Mortgage that was taken out on this home.
Original Mortgage
$100,000
Interest Rate
4.87%
Mortgage Type
Adjustable Rate Mortgage/ARM
Purchase Details
Closed on
Dec 2, 2002
Sold by
Ford William B
Bought by
Son Lan Development Co Inc
Purchase Details
Closed on
Dec 17, 2001
Sold by
Son Lan Development Co Inc
Bought by
Kohler Melony Kay
Create a Home Valuation Report for This Property
The Home Valuation Report is an in-depth analysis detailing your home's value as well as a comparison with similar homes in the area
Home Values in the Area
Average Home Value in this Area
Purchase History
| Date | Buyer | Sale Price | Title Company |
|---|---|---|---|
| Ford Michael Anthony | $127,500 | None Available | |
| Mangum Adam M | $112,500 | None Available | |
| Son Lan Development Co Inc | $73,000 | -- | |
| Kohler Melony Kay | -- | -- |
Source: Public Records
Mortgage History
| Date | Status | Borrower | Loan Amount |
|---|---|---|---|
| Open | Ford Michael Anthony | $101,000 | |
| Previous Owner | Mangum Adam M | $100,000 |
Source: Public Records
Tax History Compared to Growth
Tax History
| Year | Tax Paid | Tax Assessment Tax Assessment Total Assessment is a certain percentage of the fair market value that is determined by local assessors to be the total taxable value of land and additions on the property. | Land | Improvement |
|---|---|---|---|---|
| 2025 | $1,748 | $275,210 | $110,500 | $164,710 |
| 2024 | $1,127 | $139,160 | $63,700 | $75,460 |
| 2023 | $1,092 | $139,160 | $63,700 | $75,460 |
| 2022 | $1,127 | $139,160 | $63,700 | $75,460 |
| 2021 | $1,127 | $139,160 | $63,700 | $75,460 |
| 2020 | $1,169 | $139,160 | $63,700 | $75,460 |
| 2019 | $1,141 | $139,160 | $63,700 | $75,460 |
| 2018 | $1,067 | $127,030 | $63,700 | $63,330 |
| 2017 | $1,067 | $127,030 | $63,700 | $63,330 |
| 2016 | $1,067 | $127,030 | $63,700 | $63,330 |
| 2015 | $1,067 | $127,030 | $63,700 | $63,330 |
| 2014 | $1,067 | $127,030 | $63,700 | $63,330 |
Source: Public Records
Map
Nearby Homes
- 120 Line Dr
- 221 Old Hickory Dr
- 272 Travel Lite Dr
- 392 Travel Lite Dr
- 595 Durwood Dr
- 618 Durwood Dr
- 408 Johnston Rd
- 170 Sallyport Ct
- 6408 Glen Brack Ct
- 6908 Longridge Dr
- 48 Banbury Ct
- 212 Fox Pen Dr
- 1153 Polo Dr
- 7508 Frasier Fir Place
- 4212 Rockside Hills Dr
- 50 Linden Ct
- 648 Fieldtrial Cir
- 105 Huckleberry Ct
- 401 Blackberry Creek Dr
- 413 Fieldtrial Cir