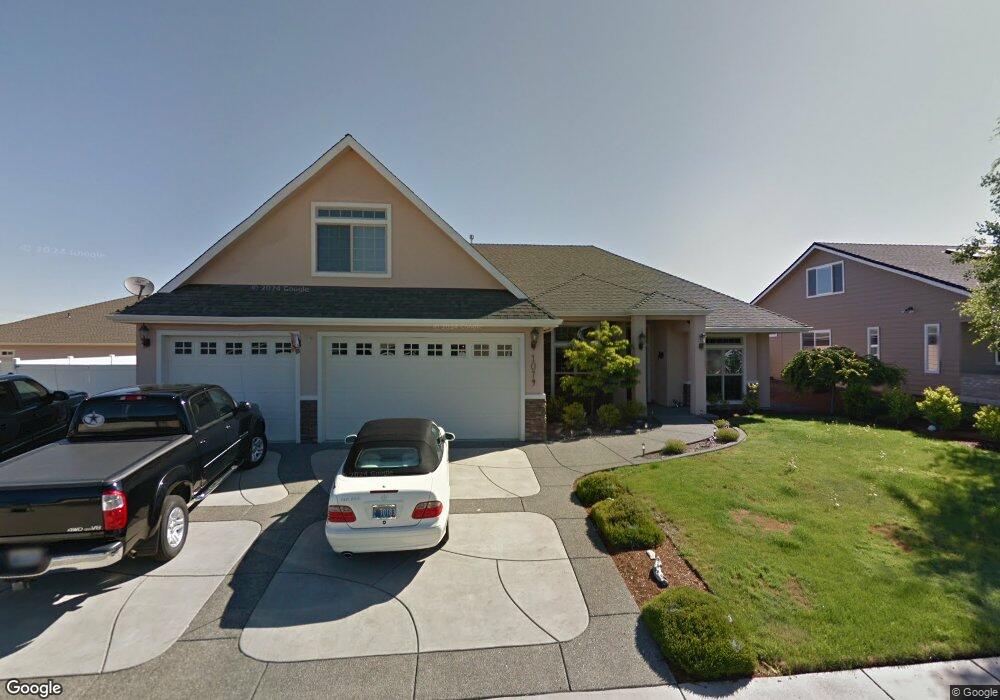
1079 Pumpkin Ridge Eagle Point, OR 97524
Estimated Value: $616,466 - $690,000
3
Beds
2
Baths
2,734
Sq Ft
$237/Sq Ft
Est. Value
About This Home
This home is located at 1079 Pumpkin Ridge, Eagle Point, OR 97524 and is currently estimated at $647,867, approximately $236 per square foot. 1079 Pumpkin Ridge is a home located in Jackson County with nearby schools including Eagle Point Middle School, White Mountain Middle School, and Eagle Point High School.
Ownership History
Date
Name
Owned For
Owner Type
Purchase Details
Closed on
Sep 30, 2019
Sold by
Johnson Rex Curtis and Johnson Debbie L
Bought by
Johnson Rex Curtis and Johnson Debbie Lynn
Current Estimated Value
Purchase Details
Closed on
Jul 21, 2004
Sold by
Jack Magel Construction Inc
Bought by
Johnson Rex Curtis and Johnson Debbie L
Home Financials for this Owner
Home Financials are based on the most recent Mortgage that was taken out on this home.
Original Mortgage
$320,000
Outstanding Balance
$162,857
Interest Rate
6.27%
Mortgage Type
Construction
Estimated Equity
$485,010
Purchase Details
Closed on
Dec 5, 2003
Sold by
Eagle Point Developments Llc
Bought by
Jack Magel Construction Inc
Home Financials for this Owner
Home Financials are based on the most recent Mortgage that was taken out on this home.
Original Mortgage
$79,120
Interest Rate
6.04%
Mortgage Type
Purchase Money Mortgage
Create a Home Valuation Report for This Property
The Home Valuation Report is an in-depth analysis detailing your home's value as well as a comparison with similar homes in the area
Home Values in the Area
Average Home Value in this Area
Purchase History
| Date | Buyer | Sale Price | Title Company |
|---|---|---|---|
| Johnson Rex Curtis | -- | None Available | |
| Johnson Rex Curtis | $100,000 | Lawyers Title Ins | |
| Jack Magel Construction Inc | $98,900 | Lawyers Title Insurance Corp |
Source: Public Records
Mortgage History
| Date | Status | Borrower | Loan Amount |
|---|---|---|---|
| Open | Johnson Rex Curtis | $320,000 | |
| Previous Owner | Jack Magel Construction Inc | $79,120 | |
| Closed | Jack Magel Construction Inc | $40,000 |
Source: Public Records
Tax History
| Year | Tax Paid | Tax Assessment Tax Assessment Total Assessment is a certain percentage of the fair market value that is determined by local assessors to be the total taxable value of land and additions on the property. | Land | Improvement |
|---|---|---|---|---|
| 2026 | $5,245 | $385,470 | -- | -- |
| 2025 | $5,121 | $374,250 | $101,760 | $272,490 |
| 2024 | $5,121 | $363,350 | $98,790 | $264,560 |
| 2023 | $4,947 | $352,770 | $95,920 | $256,850 |
| 2022 | $4,812 | $352,770 | $95,920 | $256,850 |
| 2021 | $4,670 | $342,500 | $93,130 | $249,370 |
| 2020 | $4,961 | $332,530 | $90,420 | $242,110 |
| 2019 | $4,885 | $313,450 | $85,230 | $228,220 |
| 2018 | $4,792 | $304,330 | $82,740 | $221,590 |
| 2017 | $4,674 | $304,330 | $82,740 | $221,590 |
| 2016 | $4,583 | $286,870 | $78,000 | $208,870 |
| 2015 | $4,434 | $286,870 | $78,000 | $208,870 |
| 2014 | $4,307 | $270,410 | $73,520 | $196,890 |
Source: Public Records
Map
Nearby Homes
- 279 Robert Trent Jones Blvd
- 374 Leandra Ln
- 1043 Arrowhead Trail
- 1135 Pumpkin Ridge Unit 319
- 1140 Pumpkin Ridge Unit 336
- 1146 Pumpkin Unit 335
- 997 Arrowhead Trail
- 995 Pumpkin Ridge
- 1151 Arrowhead Trail
- 74 Eagle View Dr
- 1147 Pumpkin Unit 321
- 1152 Pumpkin Unit 334
- 1164 Pumpkin Unit 332
- 1159 Pumpkin Ridge Unit 323
- 384 Robert Trent Jones Blvd
- 964 Pumpkin Ridge
- 1153 Pumpkin Unit 322
- 936 Arrowhead Trail
- 131 Spanish Bay Ct
- 869 St Andrews Way
- 1085 Pumpkin Ridge
- 252 Bellerive Dr
- 286 Bellerive Dr
- 258 Bellerive Dr
- 286 Robert Trent Jones Jr Blvd
- 286 Robert Trent Jones Blvd
- 280 Robert Trent Jones Blvd
- 292 Robert Trent Jones Jr
- 292 Robert Trent Jones Blvd
- 1080 Pumpkin Ridge
- 1074 Pumpkin Ridge
- 274 Robert Trent Jones Blvd
- 959 Pumpkin Ridge
- 995 St Andrews Way
- 264 Bellerive Dr
- 1068 Pumpkin Ridge
- 249 Bellerive Dr
- 1093 Pumpkin Ridge
- 1065 Pumpkin Ridge
- 1065 Pumpkin Ridge Dr
Your Personal Tour Guide
Ask me questions while you tour the home.