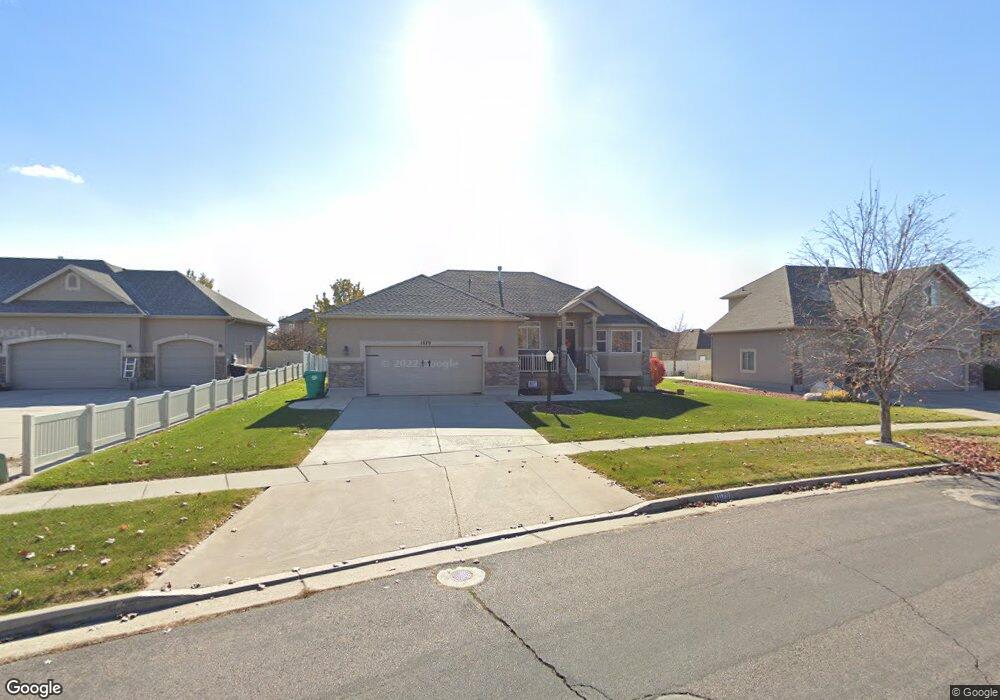
1079 W 3090 S Syracuse, UT 84075
Estimated Value: $566,000 - $623,000
5
Beds
2
Baths
1,423
Sq Ft
$421/Sq Ft
Est. Value
About This Home
This home is located at 1079 W 3090 S, Syracuse, UT 84075 and is currently estimated at $599,668, approximately $421 per square foot. 1079 W 3090 S is a home located in Davis County with nearby schools including Bluff Ridge Elementary, Legacy Junior High School, and Clearfield High School.
Ownership History
Date
Name
Owned For
Owner Type
Purchase Details
Closed on
Sep 19, 2020
Sold by
Lots Phillip G and Lots Camille J
Bought by
Lots Camille J
Current Estimated Value
Home Financials for this Owner
Home Financials are based on the most recent Mortgage that was taken out on this home.
Original Mortgage
$25,000
Outstanding Balance
$22,107
Interest Rate
2.71%
Mortgage Type
Credit Line Revolving
Estimated Equity
$577,561
Purchase Details
Closed on
Mar 26, 2008
Sold by
Lots Phillip G
Bought by
Lots Phillip G and Lots Camille J
Home Financials for this Owner
Home Financials are based on the most recent Mortgage that was taken out on this home.
Original Mortgage
$267,338
Outstanding Balance
$166,369
Interest Rate
5.72%
Mortgage Type
New Conventional
Estimated Equity
$433,299
Purchase Details
Closed on
Feb 21, 2006
Sold by
Benchmark Real Estate Co
Bought by
Lots Phillip G
Home Financials for this Owner
Home Financials are based on the most recent Mortgage that was taken out on this home.
Original Mortgage
$45,600
Interest Rate
5.66%
Mortgage Type
Stand Alone Second
Create a Home Valuation Report for This Property
The Home Valuation Report is an in-depth analysis detailing your home's value as well as a comparison with similar homes in the area
Home Values in the Area
Average Home Value in this Area
Purchase History
| Date | Buyer | Sale Price | Title Company |
|---|---|---|---|
| Lots Camille J | -- | Pinnacle Title Ins A | |
| Lots Phillip G | -- | Inwest Title Services Inc | |
| Lots Phillip G | -- | Founders Title Co |
Source: Public Records
Mortgage History
| Date | Status | Borrower | Loan Amount |
|---|---|---|---|
| Open | Lots Camille J | $25,000 | |
| Open | Lots Phillip G | $267,338 | |
| Closed | Lots Phillip G | $45,600 | |
| Closed | Lots Phillip G | $182,400 |
Source: Public Records
Tax History Compared to Growth
Tax History
| Year | Tax Paid | Tax Assessment Tax Assessment Total Assessment is a certain percentage of the fair market value that is determined by local assessors to be the total taxable value of land and additions on the property. | Land | Improvement |
|---|---|---|---|---|
| 2025 | $3,067 | $295,900 | $123,707 | $172,193 |
| 2024 | $3,035 | $294,800 | $101,129 | $193,671 |
| 2023 | $2,865 | $507,000 | $140,978 | $366,022 |
| 2022 | $2,987 | $289,850 | $81,315 | $208,535 |
| 2021 | $2,703 | $406,000 | $120,031 | $285,969 |
| 2020 | $2,379 | $346,000 | $105,154 | $240,846 |
| 2019 | $2,299 | $330,000 | $102,057 | $227,943 |
| 2018 | $2,126 | $303,000 | $98,955 | $204,045 |
| 2016 | $1,900 | $142,010 | $38,008 | $104,002 |
| 2015 | $1,933 | $137,555 | $38,008 | $99,547 |
| 2014 | $1,801 | $130,638 | $38,008 | $92,630 |
| 2013 | -- | $139,272 | $32,571 | $106,701 |
Source: Public Records
Map
Nearby Homes
- 1139 W 3150 S
- 967 W Yamada Ct
- 2958 S 1320 W
- 2766 S 1200 W
- 803 W 2800 S
- 3528 S Finch St
- 1137 W 2500 S
- 3074 S Edgewater Ln
- 1546 W Parkview Dr
- 3637 S Creek Side Ln
- 3067 S Old Emigrant Rd Unit B
- 2784 S 1720 W Unit F
- 3169 S 550 W
- 2223 S Allison Way
- 2480 S 1150 W
- 1701 W Ross Rd
- 1694 2975 S Unit D
- 2744 S Allison Way Unit 211
- 2742 S Allison Way Unit 212
- 1667 W 2770 S Unit 206