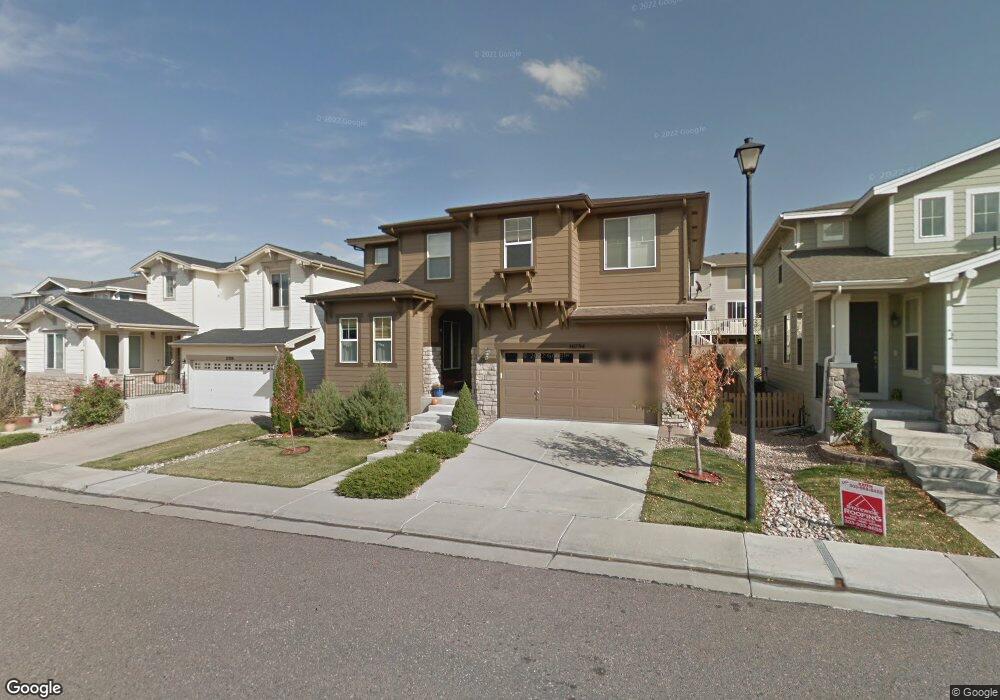
10794 Cedar Brook St Highlands Ranch, CO 80126
Southridge NeighborhoodEstimated Value: $752,849 - $789,000
4
Beds
4
Baths
2,995
Sq Ft
$258/Sq Ft
Est. Value
About This Home
This home is located at 10794 Cedar Brook St, Highlands Ranch, CO 80126 and is currently estimated at $773,962, approximately $258 per square foot. 10794 Cedar Brook St is a home located in Douglas County with nearby schools including Copper Mesa Elementary School, Mountain Ridge Middle School, and Mountain Vista High School.
Ownership History
Date
Name
Owned For
Owner Type
Purchase Details
Closed on
Jan 17, 2025
Sold by
Mcneil Matthew C and Mcneil Elissa
Bought by
Matt And Elissa Mcneil Living Trust
Current Estimated Value
Purchase Details
Closed on
Jul 25, 2020
Sold by
Hetherington Drew S and Hetherington Lisa J
Bought by
Mcneil Matthew C and Mcneil Elissa
Home Financials for this Owner
Home Financials are based on the most recent Mortgage that was taken out on this home.
Original Mortgage
$560,500
Interest Rate
3.1%
Mortgage Type
New Conventional
Purchase Details
Closed on
Mar 30, 2012
Sold by
Gogol Ada A
Bought by
Hetherington Drew S and Hetherington Lisa J
Home Financials for this Owner
Home Financials are based on the most recent Mortgage that was taken out on this home.
Original Mortgage
$313,625
Interest Rate
3.75%
Mortgage Type
FHA
Purchase Details
Closed on
Sep 16, 2003
Sold by
Shea Homes Lp
Bought by
Gogol Ada B
Create a Home Valuation Report for This Property
The Home Valuation Report is an in-depth analysis detailing your home's value as well as a comparison with similar homes in the area
Home Values in the Area
Average Home Value in this Area
Purchase History
| Date | Buyer | Sale Price | Title Company |
|---|---|---|---|
| Matt And Elissa Mcneil Living Trust | -- | None Listed On Document | |
| Mcneil Matthew C | $590,000 | Land Title Guarantee Co | |
| Hetherington Drew S | $325,000 | Land Title Guarantee Company | |
| Gogol Ada B | $280,000 | North American Title |
Source: Public Records
Mortgage History
| Date | Status | Borrower | Loan Amount |
|---|---|---|---|
| Previous Owner | Mcneil Matthew C | $560,500 | |
| Previous Owner | Hetherington Drew S | $313,625 |
Source: Public Records
Tax History Compared to Growth
Tax History
| Year | Tax Paid | Tax Assessment Tax Assessment Total Assessment is a certain percentage of the fair market value that is determined by local assessors to be the total taxable value of land and additions on the property. | Land | Improvement |
|---|---|---|---|---|
| 2024 | $4,495 | $51,380 | $10,880 | $40,500 |
| 2023 | $4,487 | $51,380 | $10,880 | $40,500 |
| 2022 | $3,433 | $37,580 | $7,970 | $29,610 |
| 2021 | $3,571 | $37,580 | $7,970 | $29,610 |
| 2020 | $3,203 | $34,540 | $7,050 | $27,490 |
| 2019 | $3,215 | $34,540 | $7,050 | $27,490 |
| 2018 | $2,920 | $30,900 | $6,510 | $24,390 |
| 2017 | $2,659 | $30,900 | $6,510 | $24,390 |
| 2016 | $2,663 | $30,370 | $5,960 | $24,410 |
| 2015 | $2,720 | $30,370 | $5,960 | $24,410 |
| 2014 | $2,472 | $25,490 | $5,410 | $20,080 |
Source: Public Records
Map
Nearby Homes
- 10753 Cedar Brook Ln
- 10858 Fairmont Ln
- 10832 Hickory Ridge Ln
- 10582 Ashfield St
- 10674 Cherrington St
- 3092 Windridge Cir
- 10580 Parkington Ln Unit B
- 10994 Shadowbrook Cir
- 3229 Green Haven Cir
- 3047 Windridge Cir
- 3171 Green Haven Cir
- 10837 Fox Sedge Way
- 10896 Valleybrook Cir
- 3070 Redhaven Way
- 3000 Fox Sedge Ln
- 3791 Charterwood Cir
- 10254 Willowbridge Ct
- 10653 Briarglen Cir
- 2934 Braeburn Way
- 2996 Danbury Ave
- 10802 Cedar Brook St
- 10788 Cedar Brook St
- 10795 Fairmont Ln
- 10803 Fairmont Ln
- 10808 Cedar Brook St
- 10774 Cedar Brook St
- 10787 Fairmont Ln
- 10811 Fairmont Ln
- 10793 Cedar Brook St
- 10801 Cedar Brook St
- 10812 Cedar Brook St
- 10785 Cedar Brook St
- 10819 Fairmont Ln
- 10807 Cedar Brook St
- 10777 Cedar Brook St
- 10820 Cedar Brook St
- 10827 Fairmont Ln
- 10813 Cedar Brook St
- 10769 Cedar Brook St
- 10796 Fairmont Ln