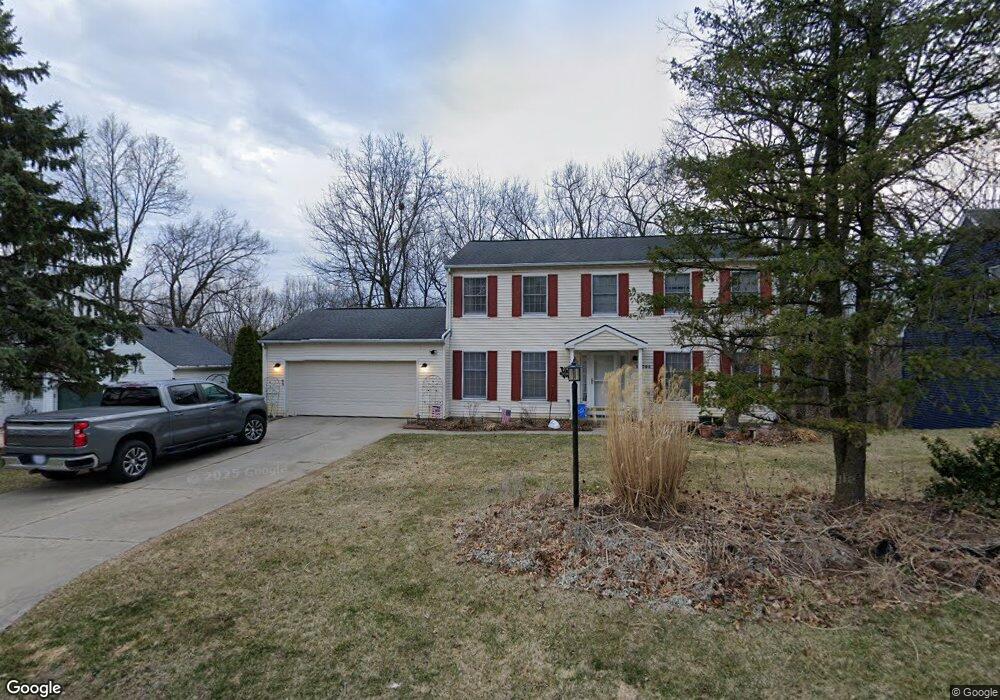
10795 Charring Cross Cir Whitmore Lake, MI 48189
Estimated Value: $404,125 - $510,000
3
Beds
3
Baths
2,128
Sq Ft
$211/Sq Ft
Est. Value
About This Home
This home is located at 10795 Charring Cross Cir, Whitmore Lake, MI 48189 and is currently estimated at $448,781, approximately $210 per square foot. 10795 Charring Cross Cir is a home located in Livingston County with nearby schools including Whitmore Lake Elementary School, Whitmore Lake High School, and Livingston Classical Academy.
Ownership History
Date
Name
Owned For
Owner Type
Purchase Details
Closed on
May 13, 2015
Sold by
Waterstradt Breanna
Bought by
Waterstradt Steven J and Waterstradt Breanna
Current Estimated Value
Purchase Details
Closed on
Aug 11, 2009
Sold by
Federal Home Loan Mortgage Corporation
Bought by
Waterstradt Steven J
Home Financials for this Owner
Home Financials are based on the most recent Mortgage that was taken out on this home.
Original Mortgage
$132,080
Interest Rate
5.21%
Mortgage Type
Purchase Money Mortgage
Purchase Details
Closed on
Oct 3, 2003
Sold by
Billo John M and Billo Jacqueline A
Bought by
Petchell Michael L and Petchell Cathy
Purchase Details
Closed on
Jun 14, 1999
Sold by
Whittaker Robert B
Bought by
Billo John M and Metry Jacqueline A
Home Financials for this Owner
Home Financials are based on the most recent Mortgage that was taken out on this home.
Original Mortgage
$208,900
Interest Rate
7.29%
Create a Home Valuation Report for This Property
The Home Valuation Report is an in-depth analysis detailing your home's value as well as a comparison with similar homes in the area
Home Values in the Area
Average Home Value in this Area
Purchase History
| Date | Buyer | Sale Price | Title Company |
|---|---|---|---|
| Waterstradt Steven J | -- | -- | |
| Waterstradt Steven J | $165,100 | -- | |
| Petchell Michael L | $245,900 | -- | |
| Billo John M | $219,900 | Liberty Title Company |
Source: Public Records
Mortgage History
| Date | Status | Borrower | Loan Amount |
|---|---|---|---|
| Previous Owner | Waterstradt Steven J | $132,080 | |
| Previous Owner | Billo John M | $208,900 |
Source: Public Records
Tax History Compared to Growth
Tax History
| Year | Tax Paid | Tax Assessment Tax Assessment Total Assessment is a certain percentage of the fair market value that is determined by local assessors to be the total taxable value of land and additions on the property. | Land | Improvement |
|---|---|---|---|---|
| 2025 | $972 | $185,400 | $0 | $0 |
| 2024 | $944 | $169,700 | $0 | $0 |
| 2023 | $900 | $152,100 | $0 | $0 |
| 2022 | $3,004 | $118,300 | $0 | $0 |
| 2021 | $3,004 | $132,100 | $0 | $0 |
| 2020 | $2,950 | $128,300 | $0 | $0 |
| 2019 | $2,869 | $118,300 | $0 | $0 |
| 2018 | $2,784 | $112,300 | $0 | $0 |
| 2017 | $2,712 | $112,900 | $0 | $0 |
| 2016 | $2,798 | $104,400 | $0 | $0 |
| 2014 | $2,540 | $94,900 | $0 | $0 |
| 2012 | $2,540 | $84,000 | $0 | $0 |
Source: Public Records
Map
Nearby Homes
- 10593 9 Mile Rd
- 10536 Oak Shore Dr
- 10468 Oak Shore Dr
- 11346 E Shore Dr
- 10456 Oak Shore Dr
- 10537 Oak Forest Dr
- 10512 Oak Forest Dr
- 10836 Tuthill Rd
- 9750 Whitmore Lake Rd
- 10403 Bouldercrest Dr
- 9736 Cross Creek Dr
- 11731 Valerie Ln
- 11433 Marshall Rd
- 11994 N Main St
- 0000 Spicer Rd
- 9090 Fielding Dr
- 9744 Chalfonte Dr
- 9691 Chalfonte Dr
- 8660 Spicer Rd
- 435 Eight Mile Rd
- 10809 Charring Cross Cir
- 10781 Charring Cross Cir
- 10823 Charring Cross Cir
- 10802 Charring Cross Cir Unit Bldg-Unit
- 10802 Charring Cross Cir
- 10788 Charring Cross Cir
- 10767 Charring Cross Cir
- 10824 Charring Cross Cir
- 10839 Charring Cross Cir
- 10766 Charring Cross Cir
- 10311 Harpers Ferry Ct Unit Bldg-Unit
- 10311 Harpers Ferry Ct
- 10848 Charring Cross Cir
- 10753 Charring Cross Cir
- 10744 Charring Cross Cir
- 10851 Charring Cross Cir
- 10299 Harpers Ferry Ct
- 10323 Harpers Ferry Ct
- 10886 Charring Cross Cir
- 10739 Charring Cross Cir