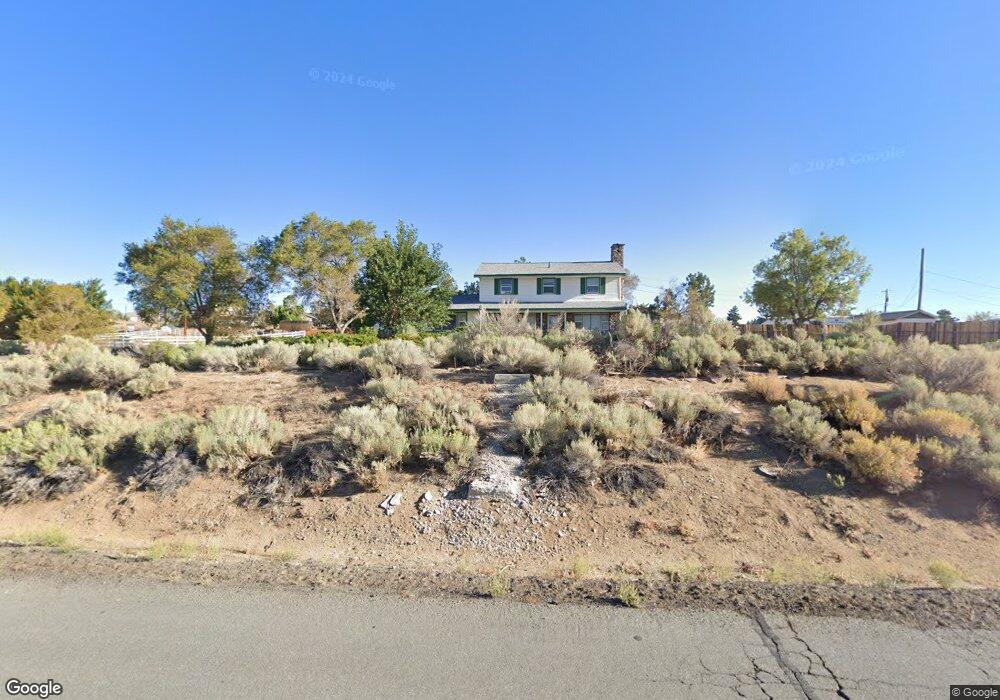
10795 Silver Knolls Blvd Unit 6A Reno, NV 89508
Stead NeighborhoodEstimated Value: $626,000 - $700,000
4
Beds
3
Baths
2,488
Sq Ft
$269/Sq Ft
Est. Value
About This Home
This home is located at 10795 Silver Knolls Blvd Unit 6A, Reno, NV 89508 and is currently estimated at $668,039, approximately $268 per square foot. 10795 Silver Knolls Blvd Unit 6A is a home located in Washoe County with nearby schools including Desert Heights Elementary School, Cold Springs Middle Schools, and North Valleys High School.
Ownership History
Date
Name
Owned For
Owner Type
Purchase Details
Closed on
Oct 7, 2011
Sold by
Deutsche Bank National Trust Company
Bought by
Grant Lynda
Current Estimated Value
Home Financials for this Owner
Home Financials are based on the most recent Mortgage that was taken out on this home.
Original Mortgage
$126,939
Interest Rate
5.5%
Mortgage Type
FHA
Purchase Details
Closed on
Jan 26, 2011
Sold by
Francis Pam R
Bought by
Deutsche Bank National Trust Company
Purchase Details
Closed on
May 5, 2006
Sold by
Francis Kenneth Lee
Bought by
Francis Pam R
Home Financials for this Owner
Home Financials are based on the most recent Mortgage that was taken out on this home.
Original Mortgage
$333,750
Interest Rate
1%
Mortgage Type
Negative Amortization
Create a Home Valuation Report for This Property
The Home Valuation Report is an in-depth analysis detailing your home's value as well as a comparison with similar homes in the area
Home Values in the Area
Average Home Value in this Area
Purchase History
| Date | Buyer | Sale Price | Title Company |
|---|---|---|---|
| Grant Lynda | $119,000 | Servicelink Irvine | |
| Deutsche Bank National Trust Company | $148,000 | Accommodation | |
| Francis Pam R | -- | First American Title |
Source: Public Records
Mortgage History
| Date | Status | Borrower | Loan Amount |
|---|---|---|---|
| Previous Owner | Grant Lynda | $126,939 | |
| Previous Owner | Francis Pam R | $333,750 |
Source: Public Records
Tax History Compared to Growth
Tax History
| Year | Tax Paid | Tax Assessment Tax Assessment Total Assessment is a certain percentage of the fair market value that is determined by local assessors to be the total taxable value of land and additions on the property. | Land | Improvement |
|---|---|---|---|---|
| 2025 | $2,269 | $87,612 | $42,000 | $45,612 |
| 2024 | $2,102 | $87,229 | $42,000 | $45,229 |
| 2023 | $2,102 | $83,705 | $42,000 | $41,705 |
| 2022 | $1,946 | $67,242 | $33,250 | $33,992 |
| 2021 | $1,802 | $55,560 | $22,400 | $33,160 |
| 2020 | $1,834 | $56,776 | $22,400 | $34,376 |
| 2019 | $1,747 | $57,261 | $22,820 | $34,441 |
| 2018 | $1,667 | $51,445 | $16,660 | $34,785 |
| 2017 | $1,661 | $51,714 | $15,750 | $35,964 |
| 2016 | $1,619 | $51,629 | $14,315 | $37,314 |
| 2015 | $1,212 | $51,013 | $12,355 | $38,658 |
| 2014 | $1,566 | $49,193 | $10,955 | $38,238 |
| 2013 | -- | $46,916 | $8,470 | $38,446 |
Source: Public Records
Map
Nearby Homes
- 10725 Santa fe Rd
- 10300 Sutters Mill Ln
- 11150 Carlsbad Rd
- 00 Plata Mesa Dr
- 10035 Osage Rd
- 10705 Silver Spur Dr
- 10605 Osage Rd
- 8350 Osage Rd
- 10150 Coyote Run Ct
- 0 N Red Rock Rd Unit 250000494
- 9500 N Red Rock Rd
- 13790 Mount Babcock St
- 13440 Fort Sage Ct
- 13250 Rolling Sage Place
- 7663 Crystal Shores Dr
- 13631 Mount Rainier St
- 8275 Shifting Sands Dr Unit 21
- 8880 Silverkist Dr
- 13630 Mount Whitney St
- 13161 Mount Logan St
- 10750 Whitehawk Dr
- 10755 Silver Knolls Blvd
- 10805 Silver Knolls Blvd
- 10750 Silver Knolls Blvd
- 10755 Whitehawk Dr
- 10775 Whitehawk Dr
- 10740 Whitehawk Dr
- 10735 Silver Knolls Blvd
- 10730 Silver Knolls Blvd
- 10800 Silver Knolls Blvd
- 10730 Whitehawk Dr
- 10725 Silver Knolls Blvd
- 10875 Silver Knolls Blvd
- 11050 Larson Ranch Rd
- 10720 Whitehawk Dr
- 10850 Longhorn Dr
- 10705 Silver Knolls Blvd
- 10725 Whitehawk Dr
- 10700 Whitehawk Dr
- 10735 Whitehawk Dr