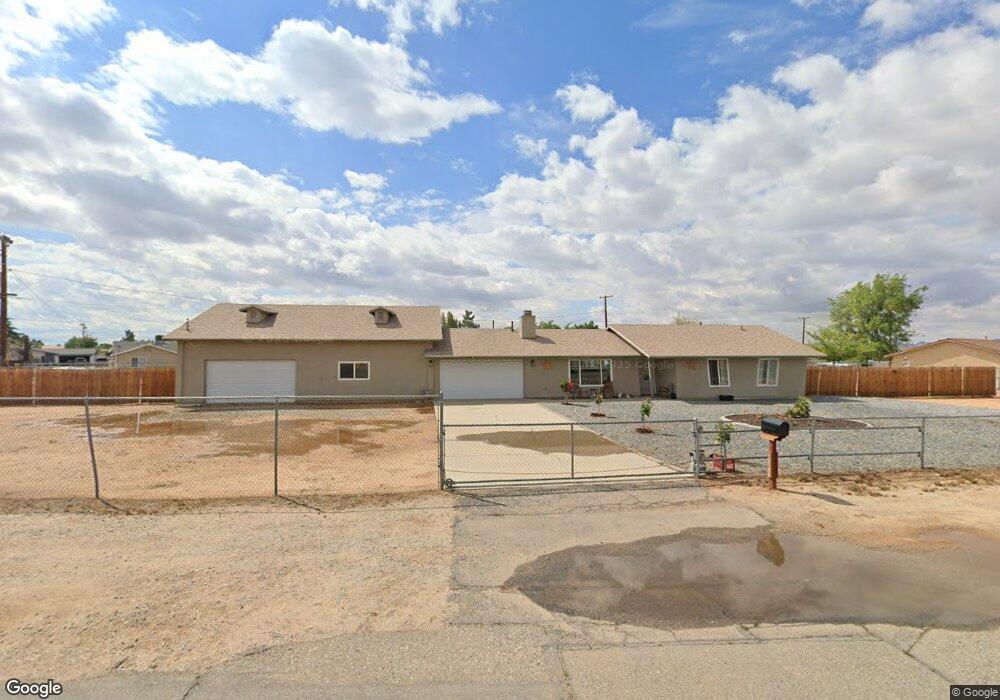
10798 Nandina Rd Apple Valley, CA 92308
High Desert NeighborhoodEstimated Value: $388,000 - $508,000
3
Beds
2
Baths
3,140
Sq Ft
$136/Sq Ft
Est. Value
About This Home
This home is located at 10798 Nandina Rd, Apple Valley, CA 92308 and is currently estimated at $428,561, approximately $136 per square foot. 10798 Nandina Rd is a home located in San Bernardino County with nearby schools including Mariana Academy and Apple Valley High School.
Ownership History
Date
Name
Owned For
Owner Type
Purchase Details
Closed on
Oct 12, 2022
Sold by
Rico George
Bought by
Salter Patrick E and Salter Margaret D
Current Estimated Value
Home Financials for this Owner
Home Financials are based on the most recent Mortgage that was taken out on this home.
Original Mortgage
$175,000
Outstanding Balance
$169,387
Interest Rate
6.94%
Mortgage Type
New Conventional
Estimated Equity
$259,174
Purchase Details
Closed on
Feb 21, 2020
Sold by
Cilio Debora
Bought by
Cilio Debora and Rico George
Purchase Details
Closed on
Jun 28, 2013
Sold by
Secretary Of Housing & Urban Development
Bought by
Cilio Debora
Home Financials for this Owner
Home Financials are based on the most recent Mortgage that was taken out on this home.
Original Mortgage
$50,000
Interest Rate
3.48%
Mortgage Type
Purchase Money Mortgage
Purchase Details
Closed on
Feb 13, 2012
Sold by
Citimortgage Inc
Bought by
Secretary Of Housing & Urban Development
Create a Home Valuation Report for This Property
The Home Valuation Report is an in-depth analysis detailing your home's value as well as a comparison with similar homes in the area
Home Values in the Area
Average Home Value in this Area
Purchase History
| Date | Buyer | Sale Price | Title Company |
|---|---|---|---|
| Salter Patrick E | $375,000 | Provident Title | |
| Cilio Debora | -- | None Available | |
| Cilio Debora | $90,500 | First American Title Company | |
| Secretary Of Housing & Urban Development | -- | Cr Title Services Inc | |
| Citimortgage Inc | $88,308 | Cr Title Services Inc |
Source: Public Records
Mortgage History
| Date | Status | Borrower | Loan Amount |
|---|---|---|---|
| Open | Salter Patrick E | $175,000 | |
| Previous Owner | Cilio Debora | $50,000 |
Source: Public Records
Tax History Compared to Growth
Tax History
| Year | Tax Paid | Tax Assessment Tax Assessment Total Assessment is a certain percentage of the fair market value that is determined by local assessors to be the total taxable value of land and additions on the property. | Land | Improvement |
|---|---|---|---|---|
| 2025 | $4,304 | $390,150 | $52,020 | $338,130 |
| 2024 | $4,304 | $382,500 | $51,000 | $331,500 |
| 2023 | $4,264 | $375,000 | $50,000 | $325,000 |
| 2022 | $2,579 | $216,981 | $28,964 | $188,017 |
| 2021 | $2,520 | $212,726 | $28,396 | $184,330 |
| 2020 | $1,508 | $122,178 | $22,419 | $99,759 |
| 2019 | $1,480 | $119,782 | $21,979 | $97,803 |
| 2018 | $1,444 | $117,433 | $21,548 | $95,885 |
| 2017 | $1,424 | $115,130 | $21,125 | $94,005 |
| 2016 | $1,342 | $112,873 | $20,711 | $92,162 |
| 2015 | $1,322 | $111,178 | $20,400 | $90,778 |
| 2014 | $1,304 | $109,000 | $20,000 | $89,000 |
Source: Public Records
Map
Nearby Homes
- 10992 Tecopa Rd
- 21295 Wisteria St
- 10575 Kiavan Rd
- 21245 Nandina Rd
- 11020 Viento Place
- 21390 Tussing Ranch Rd
- 10533 Mohawk Rd
- 1 Tussing Ranch Rd
- 21259 Rosewood St
- 10516 Mohawk Rd
- 21756 Tussing Ranch Rd
- 0 Viento Rd Unit CV22206473
- 10973 Nambe Rd
- 21055 Valencia St
- 26585 Del Oro Rd
- 10655 Cochiti Rd
- 21044 Wisteria St
- 20911 Wren St
- 22109 Tussing Ranch Rd
- 20489 Wren St
- 10798 Nandina St
- 10834 Nandina Rd
- 10797 Kiavan Rd
- 10811 Kiavan Rd
- 10777 Kiavan Rd
- 10787 Nandina Rd
- 10767 Nandina St
- 10791 Nandina Rd
- 10848 Nandina Rd
- 10767 Nandina Rd
- 10827 Nandina Rd
- 10827 Nandina St
- 10847 Kiavan Rd
- 10739 Kiavan Rd
- 10845 Nandina Rd
- 10860 Nandina Rd
- 10860 Nandina St
- 10727 Kiavan Rd
- 10861 Kiavan Rd
- 10804 Kiavan Rd