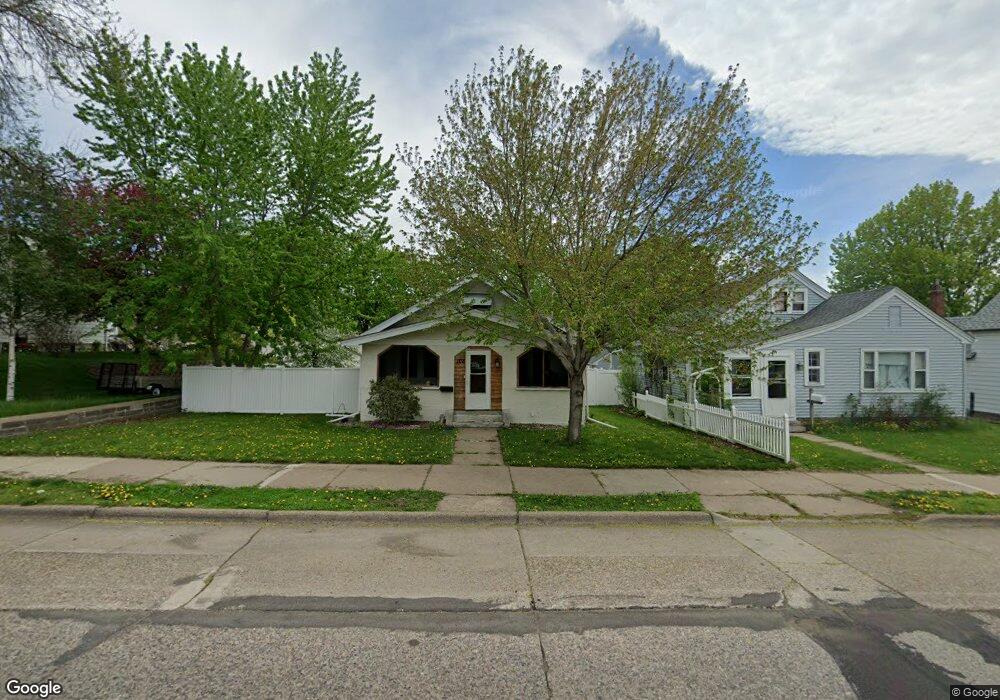
108 12th Ave N South Saint Paul, MN 55075
Estimated Value: $265,000 - $297,665
3
Beds
2
Baths
890
Sq Ft
$317/Sq Ft
Est. Value
About This Home
This home is located at 108 12th Ave N, South Saint Paul, MN 55075 and is currently estimated at $282,416, approximately $317 per square foot. 108 12th Ave N is a home located in Dakota County with nearby schools including Lincoln Center Elementary, South St. Paul Middle School, and South St. Paul Secondary.
Ownership History
Date
Name
Owned For
Owner Type
Purchase Details
Closed on
Oct 27, 2020
Sold by
Chaousy Angelo and Chaousy Claire
Bought by
Rogish Brianna Lackore
Current Estimated Value
Home Financials for this Owner
Home Financials are based on the most recent Mortgage that was taken out on this home.
Original Mortgage
$245,471
Outstanding Balance
$217,935
Interest Rate
2.8%
Mortgage Type
Second Mortgage Made To Cover Down Payment
Estimated Equity
$64,481
Purchase Details
Closed on
Aug 20, 2013
Sold by
Warren Lynn
Bought by
Chaousy Angelo and Chaousy Claire
Home Financials for this Owner
Home Financials are based on the most recent Mortgage that was taken out on this home.
Original Mortgage
$138,278
Interest Rate
4.4%
Mortgage Type
FHA
Purchase Details
Closed on
Dec 31, 2012
Sold by
Wakota Federal Credit Union
Bought by
Warren Lynn
Purchase Details
Closed on
Aug 30, 1996
Sold by
Hud
Bought by
Laberge Carol L
Purchase Details
Closed on
Nov 30, 1995
Sold by
Bank Of America
Bought by
Hud
Create a Home Valuation Report for This Property
The Home Valuation Report is an in-depth analysis detailing your home's value as well as a comparison with similar homes in the area
Home Values in the Area
Average Home Value in this Area
Purchase History
| Date | Buyer | Sale Price | Title Company |
|---|---|---|---|
| Rogish Brianna Lackore | $250,000 | Trademark Title Services Inc | |
| Chaousy Angelo | $151,000 | Burnet Title | |
| Warren Lynn | $94,000 | Dca Title | |
| Laberge Carol L | $60,500 | -- | |
| Hud | $56,693 | -- |
Source: Public Records
Mortgage History
| Date | Status | Borrower | Loan Amount |
|---|---|---|---|
| Open | Rogish Brianna Lackore | $245,471 | |
| Closed | Rogish Brianna Lackore | $245,471 | |
| Previous Owner | Chaousy Angelo | $138,278 |
Source: Public Records
Tax History Compared to Growth
Tax History
| Year | Tax Paid | Tax Assessment Tax Assessment Total Assessment is a certain percentage of the fair market value that is determined by local assessors to be the total taxable value of land and additions on the property. | Land | Improvement |
|---|---|---|---|---|
| 2024 | $4,162 | $233,400 | $54,800 | $178,600 |
| 2023 | $4,162 | $237,500 | $55,100 | $182,400 |
| 2022 | $2,612 | $234,100 | $55,100 | $179,000 |
| 2021 | $2,442 | $204,100 | $47,900 | $156,200 |
| 2020 | $2,336 | $189,300 | $45,600 | $143,700 |
| 2019 | $2,100 | $186,300 | $42,400 | $143,900 |
| 2018 | $2,081 | $164,200 | $38,500 | $125,700 |
| 2017 | $1,774 | $157,000 | $36,700 | $120,300 |
| 2016 | $1,849 | $141,100 | $33,400 | $107,700 |
| 2015 | $1,762 | $116,014 | $26,239 | $89,775 |
| 2014 | -- | $117,322 | $26,311 | $91,011 |
| 2013 | -- | $99,010 | $22,178 | $76,832 |
Source: Public Records
Map
Nearby Homes
- 101 11th Ave N
- 119 10th Ave N
- 212 11th Ave N
- 236 11th Ave S
- 127 16th Ave S
- 308 10th Ave S
- 352 12th Ave N
- 351 12th Ave N
- 339 14th Ave S
- 916 4th St N
- 425 16th Ave N
- 114 20th Ave N
- 126 20th Ave N
- 210 19th Ave S
- 450 11th Ave S
- 100 4th Ave N Unit 112
- 436 17th Ave N
- 456 10th Ave S
- 104 3rd Ave S
- 217 20th Ave S
- 108 12th Ave N
- 104 12th Ave N
- 104 104 12th-Avenue-n
- 118 12th Ave N
- 100 12th Ave N
- 108 108 12th-Avenue-n
- 126 12th Ave N
- 109 11th Ave N
- 117 11th Ave N
- 123 11th Ave N
- 111 12th Ave N
- 130 12th Ave N
- 101 12th Ave S
- 117 117 12th Ave N
- 117 117 12th-Avenue-n
- 123 12th Ave N
- 131 11th Ave N
- 134 12th Ave N
- 107 12th Ave S
- 127 127 12th Ave N