Estimated Value: $309,000 - $466,710
5
Beds
3
Baths
2,146
Sq Ft
$171/Sq Ft
Est. Value
About This Home
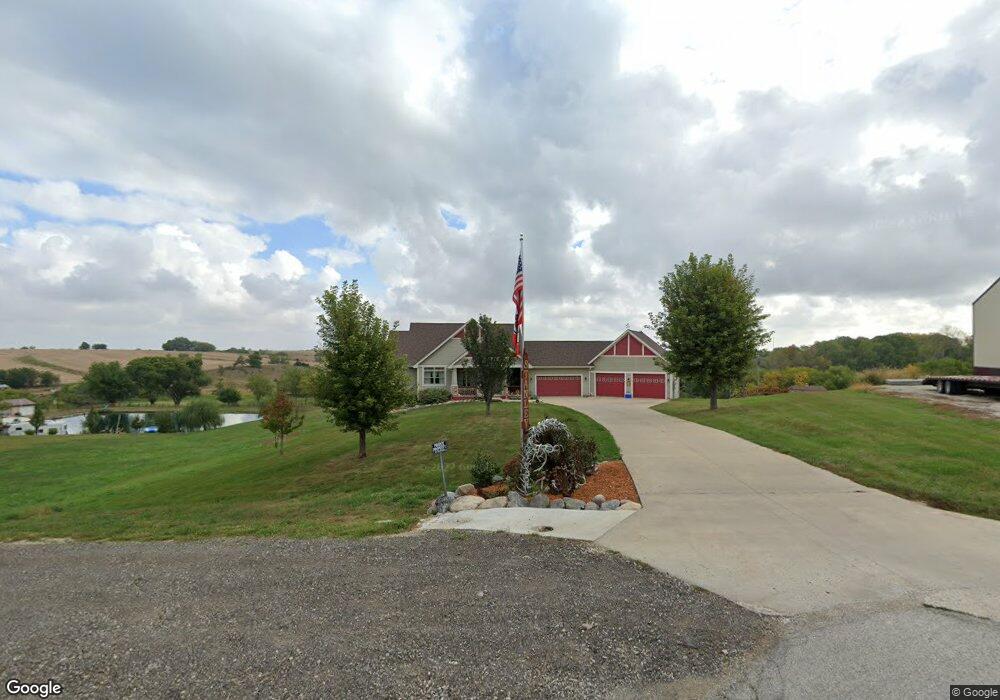
This home is located at 108 1st St, Adair, IA 50002 and is currently estimated at $367,570, approximately $171 per square foot. 108 1st St is a home located in Adair County with nearby schools including Adair-Casey Elementary School and Adair-Casey & Guthrie Center Junior High School.
Ownership History
Date
Name
Owned For
Owner Type
Purchase Details
Closed on
Jun 22, 2022
Sold by
Jacobsen Leann M and Jacobsen Anthony
Bought by
Stanley Richard A and Stanley Luann
Current Estimated Value
Purchase Details
Closed on
Apr 20, 2012
Sold by
Kelloway Brenda and Kelloway Warren
Bought by
Stanley Richard A and Stanley Luann
Home Financials for this Owner
Home Financials are based on the most recent Mortgage that was taken out on this home.
Original Mortgage
$186,000
Interest Rate
3.9%
Mortgage Type
New Conventional
Purchase Details
Closed on
Jan 19, 2011
Sold by
Kelloway Brenda and Hargin Brenda
Bought by
Kelloway Bernda and Kelloway Warren
Home Financials for this Owner
Home Financials are based on the most recent Mortgage that was taken out on this home.
Original Mortgage
$168,900
Interest Rate
4.82%
Mortgage Type
New Conventional
Create a Home Valuation Report for This Property
The Home Valuation Report is an in-depth analysis detailing your home's value as well as a comparison with similar homes in the area
Purchase History
| Date | Buyer | Sale Price | Title Company |
|---|---|---|---|
| Stanley Richard A | $100,000 | None Listed On Document | |
| Stanley Richard A | $245,000 | None Available | |
| Kelloway Bernda | -- | None Available |
Source: Public Records
Mortgage History
| Date | Status | Borrower | Loan Amount |
|---|---|---|---|
| Previous Owner | Stanley Richard A | $186,000 | |
| Previous Owner | Kelloway Bernda | $168,900 |
Source: Public Records
Tax History
| Year | Tax Paid | Tax Assessment Tax Assessment Total Assessment is a certain percentage of the fair market value that is determined by local assessors to be the total taxable value of land and additions on the property. | Land | Improvement |
|---|---|---|---|---|
| 2025 | $6,912 | $458,790 | $39,950 | $418,840 |
| 2024 | $6,912 | $412,420 | $39,950 | $372,470 |
| 2023 | $6,314 | $412,420 | $39,950 | $372,470 |
| 2022 | $6,004 | $317,360 | $21,970 | $295,390 |
| 2021 | $6,004 | $317,360 | $21,970 | $295,390 |
| 2020 | $5,742 | $293,840 | $21,970 | $271,870 |
| 2019 | $5,522 | $293,840 | $0 | $0 |
| 2018 | $5,264 | $0 | $0 | $0 |
| 2017 | $5,322 | $271,137 | $0 | $0 |
| 2016 | $5,208 | $280,410 | $22,990 | $257,420 |
| 2015 | $5,208 | $233,904 | $0 | $0 |
| 2014 | $4,584 | $231,639 | $0 | $0 |
Source: Public Records
Map
Nearby Homes
Your Personal Tour Guide
Ask me questions while you tour the home.