108 3rd St SW Chisholm, MN 55719
Estimated Value: $99,000 - $119,000
4
Beds
1
Bath
1,815
Sq Ft
$58/Sq Ft
Est. Value
About This Home
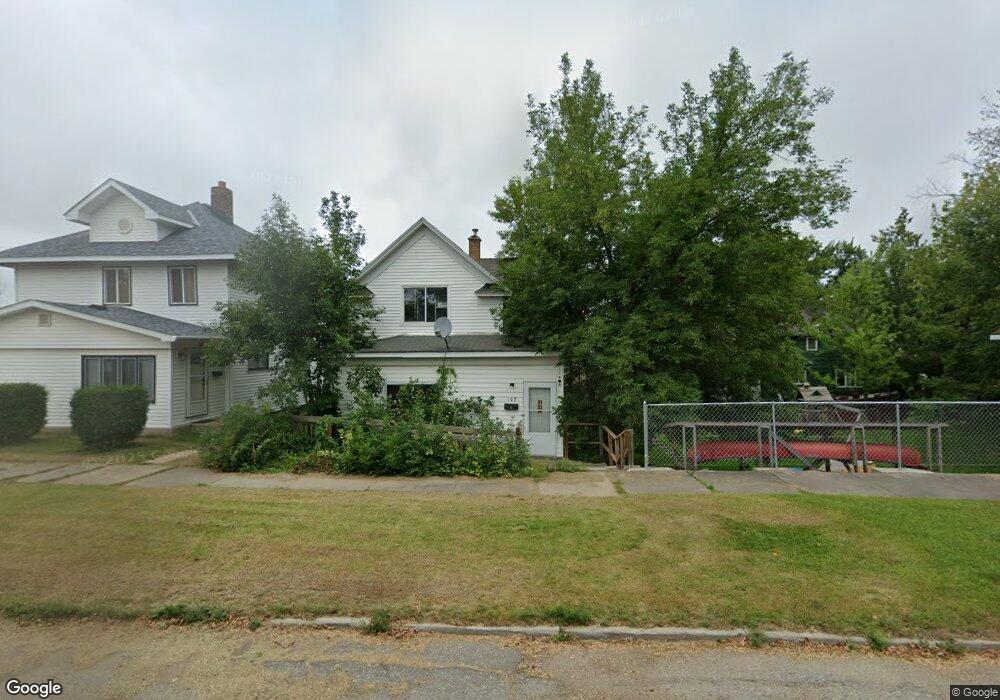
This home is located at 108 3rd St SW, Chisholm, MN 55719 and is currently estimated at $104,854, approximately $57 per square foot. 108 3rd St SW is a home located in St. Louis County with nearby schools including Vaughan Elementary School, Chisholm Elementary School, and Chisholm Secondary School.
Ownership History
Date
Name
Owned For
Owner Type
Purchase Details
Closed on
Sep 3, 2021
Sold by
Jbs Holdings
Bought by
Kirchen Ashley J
Current Estimated Value
Home Financials for this Owner
Home Financials are based on the most recent Mortgage that was taken out on this home.
Original Mortgage
$75,000
Interest Rate
6.53%
Mortgage Type
Land Contract Argmt. Of Sale
Purchase Details
Closed on
Aug 27, 2021
Sold by
Wjs Holdings Llc
Bought by
Jbs Holdings Llc
Home Financials for this Owner
Home Financials are based on the most recent Mortgage that was taken out on this home.
Original Mortgage
$75,000
Interest Rate
6.53%
Mortgage Type
Land Contract Argmt. Of Sale
Purchase Details
Closed on
Oct 22, 2012
Sold by
Us Bank National Association Nd
Bought by
Wjs Holdings Llc
Purchase Details
Closed on
Sep 1, 2011
Sold by
Lapse Llc
Bought by
U S Bank National Association Nd
Purchase Details
Closed on
May 22, 2006
Sold by
Pucel Olga and Saltzman Marvin D
Bought by
Lapse Llc
Create a Home Valuation Report for This Property
The Home Valuation Report is an in-depth analysis detailing your home's value as well as a comparison with similar homes in the area
Home Values in the Area
Average Home Value in this Area
Purchase History
| Date | Buyer | Sale Price | Title Company |
|---|---|---|---|
| Kirchen Ashley J | $75,000 | Abstract Service Co | |
| Jbs Holdings Llc | -- | Abstract Service Co | |
| Wjs Holdings Llc | $9,000 | North American Title Co | |
| U S Bank National Association Nd | $40,100 | None Available | |
| Lapse Llc | $15,200 | None Available | |
| Kirchen Ashley Ashley | $75,000 | -- |
Source: Public Records
Mortgage History
| Date | Status | Borrower | Loan Amount |
|---|---|---|---|
| Closed | Kirchen Ashley J | $75,000 |
Source: Public Records
Tax History Compared to Growth
Tax History
| Year | Tax Paid | Tax Assessment Tax Assessment Total Assessment is a certain percentage of the fair market value that is determined by local assessors to be the total taxable value of land and additions on the property. | Land | Improvement |
|---|---|---|---|---|
| 2024 | $208 | $46,700 | $3,900 | $42,800 |
| 2023 | $208 | $52,000 | $4,200 | $47,800 |
| 2022 | $576 | $43,400 | $3,500 | $39,900 |
| 2021 | $556 | $32,500 | $2,100 | $30,400 |
| 2020 | $528 | $29,800 | $2,100 | $27,700 |
| 2019 | $540 | $29,800 | $2,100 | $27,700 |
| 2018 | $1,006 | $29,800 | $2,100 | $27,700 |
| 2017 | $398 | $29,800 | $2,100 | $27,700 |
| 2016 | $734 | $23,700 | $2,500 | $21,200 |
| 2015 | $362 | $23,700 | $2,500 | $21,200 |
| 2014 | $362 | $18,300 | $2,500 | $15,800 |
Source: Public Records
Map
Nearby Homes