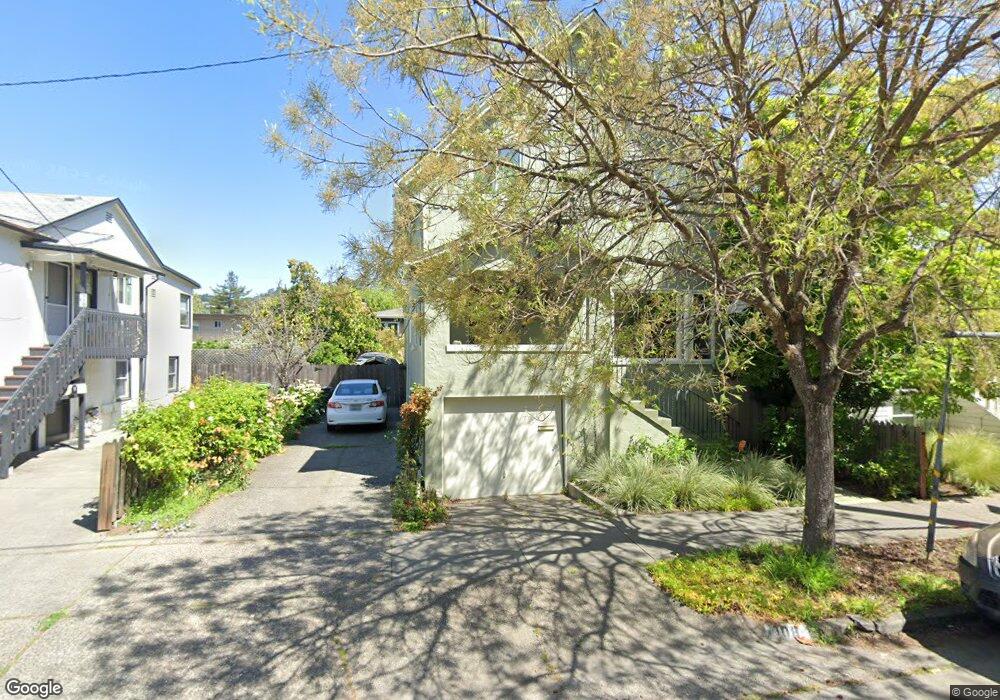
108 Bayview St San Rafael, CA 94901
Gerstle Park NeighborhoodEstimated Value: $1,065,000 - $1,572,000
4
Beds
2
Baths
1,950
Sq Ft
$638/Sq Ft
Est. Value
About This Home
This home is located at 108 Bayview St, San Rafael, CA 94901 and is currently estimated at $1,245,065, approximately $638 per square foot. 108 Bayview St is a home located in Marin County with nearby schools including Laurel Dell Elementary School, James B. Davidson Middle School, and San Rafael High School.
Ownership History
Date
Name
Owned For
Owner Type
Purchase Details
Closed on
Aug 25, 2021
Sold by
Joseph Canziani Jr John
Bought by
Canziani Family Trust
Current Estimated Value
Purchase Details
Closed on
Mar 23, 2004
Sold by
Canziani John J
Bought by
Canziani John J and Canziani Therese M
Purchase Details
Closed on
Dec 14, 1998
Sold by
Canziani John J and The Jeanette M Prandi 1997 Tru
Bought by
Canziani John J
Purchase Details
Closed on
Jun 2, 1997
Sold by
Canziani Jeannette M and Prandi Jeannette M
Bought by
Prandi Jeannette M and The Jeannette M Prandi 1997 Tr
Create a Home Valuation Report for This Property
The Home Valuation Report is an in-depth analysis detailing your home's value as well as a comparison with similar homes in the area
Home Values in the Area
Average Home Value in this Area
Purchase History
| Date | Buyer | Sale Price | Title Company |
|---|---|---|---|
| Canziani Family Trust | -- | -- | |
| Canziani John J | -- | -- | |
| Canziani John J | -- | -- | |
| Prandi Jeannette M | -- | -- |
Source: Public Records
Tax History
| Year | Tax Paid | Tax Assessment Tax Assessment Total Assessment is a certain percentage of the fair market value that is determined by local assessors to be the total taxable value of land and additions on the property. | Land | Improvement |
|---|---|---|---|---|
| 2025 | $5,296 | $234,222 | $105,556 | $128,666 |
| 2024 | $4,883 | $229,629 | $103,486 | $126,143 |
| 2023 | $4,730 | $225,127 | $101,457 | $123,670 |
| 2022 | $4,532 | $220,713 | $99,468 | $121,245 |
| 2021 | $4,461 | $216,386 | $97,518 | $118,868 |
| 2020 | $4,375 | $214,168 | $96,518 | $117,650 |
| 2019 | $4,100 | $209,969 | $94,626 | $115,343 |
| 2018 | $4,054 | $205,853 | $92,771 | $113,082 |
| 2017 | $3,927 | $201,817 | $90,952 | $110,865 |
| 2016 | $3,778 | $197,861 | $89,169 | $108,692 |
| 2015 | $3,617 | $194,889 | $87,830 | $107,059 |
| 2014 | $3,444 | $191,072 | $86,110 | $104,962 |
Source: Public Records
Map
Nearby Homes
Your Personal Tour Guide
Ask me questions while you tour the home.