Estimated Value: $175,000 - $246,000
3
Beds
2
Baths
2,488
Sq Ft
$85/Sq Ft
Est. Value
About This Home
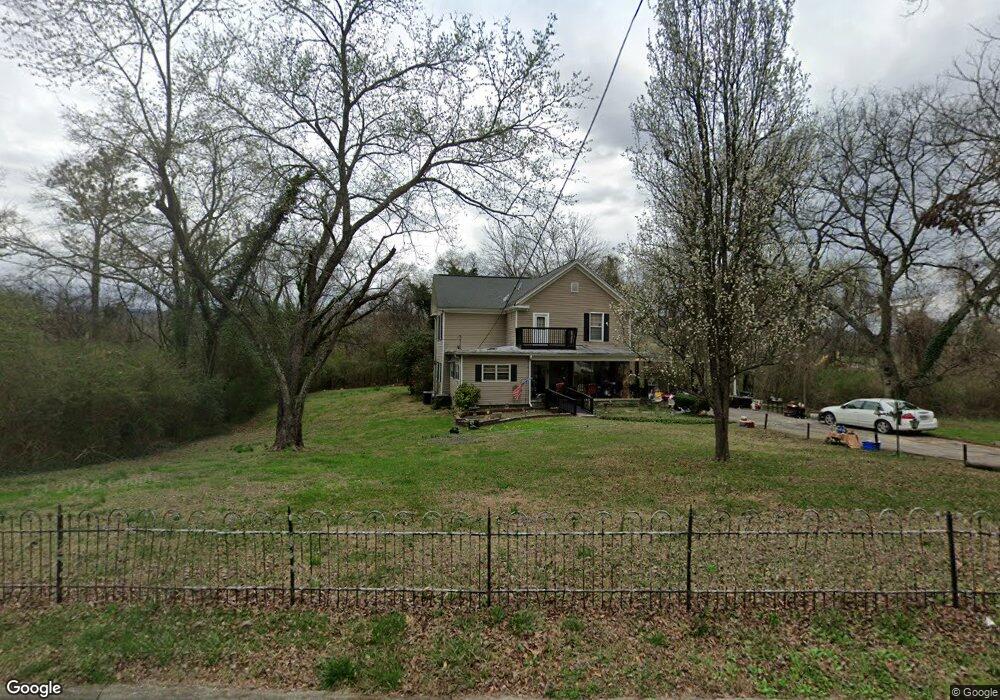
This home is located at 108 Blacks Bluff Rd SW, Rome, GA 30161 and is currently estimated at $211,687, approximately $85 per square foot. 108 Blacks Bluff Rd SW is a home located in Floyd County with nearby schools including Dan McCarty Middle School, Rome High School, and Darlington School.
Ownership History
Date
Name
Owned For
Owner Type
Purchase Details
Closed on
Aug 6, 2024
Sold by
Thomas Billy D
Bought by
Cja Properties Llc
Current Estimated Value
Purchase Details
Closed on
Jul 21, 2014
Sold by
Thomas Debra
Bought by
Thomas Glenda Grace
Purchase Details
Closed on
Dec 18, 2009
Sold by
Thomas Glenda
Bought by
Thomas Debra
Purchase Details
Closed on
Oct 23, 2003
Sold by
Thomas Billy D
Bought by
Thomas Billy D and Thomas Glenda G
Purchase Details
Closed on
Sep 10, 1968
Sold by
Bates William E
Bought by
Thomas Billy D
Purchase Details
Closed on
Jun 20, 1964
Sold by
Bagwell John W
Bought by
Bates William E
Purchase Details
Closed on
Sep 1, 1963
Sold by
Wood Abott L
Bought by
Bagwell John W
Purchase Details
Closed on
Jan 1, 1901
Bought by
Wood Abott L
Create a Home Valuation Report for This Property
The Home Valuation Report is an in-depth analysis detailing your home's value as well as a comparison with similar homes in the area
Home Values in the Area
Average Home Value in this Area
Purchase History
| Date | Buyer | Sale Price | Title Company |
|---|---|---|---|
| Cja Properties Llc | $110,000 | -- | |
| Thomas Glenda Grace | -- | -- | |
| Thomas Debra | -- | -- | |
| Thomas Billy D | -- | -- | |
| Thomas Billy D | $10,500 | -- | |
| Bates William E | $6,500 | -- | |
| Bagwell John W | -- | -- | |
| Wood Abott L | -- | -- |
Source: Public Records
Tax History Compared to Growth
Tax History
| Year | Tax Paid | Tax Assessment Tax Assessment Total Assessment is a certain percentage of the fair market value that is determined by local assessors to be the total taxable value of land and additions on the property. | Land | Improvement |
|---|---|---|---|---|
| 2024 | $2,628 | $68,050 | $5,455 | $62,595 |
| 2023 | $1,032 | $65,123 | $4,959 | $60,164 |
| 2022 | $851 | $52,247 | $4,053 | $48,194 |
| 2021 | $756 | $45,915 | $3,695 | $42,220 |
| 2020 | $716 | $43,035 | $3,213 | $39,822 |
| 2019 | $661 | $40,615 | $3,213 | $37,402 |
| 2018 | $651 | $38,108 | $3,060 | $35,048 |
| 2017 | $651 | $35,682 | $2,800 | $32,882 |
| 2016 | $1,325 | $35,680 | $2,800 | $32,880 |
| 2015 | $1,349 | $38,470 | $2,800 | $35,670 |
| 2014 | $1,349 | $38,470 | $2,800 | $35,670 |
Source: Public Records
Map
Nearby Homes
- 25 Blacks Bluff Rd SW
- 2055 Blacks Bluff Rd SW
- 11 Blacks Bluff Rd SW
- 44 Marvin Crowe Dr SW
- 3 Porter St SW
- 529 Branham Ave SW
- 7 Pine Valley Rd SW
- 316 S McLin St SW
- 8 Crestwood Dr SW
- 5 Jervis St SW
- 50 Wallace Dr SW
- 13 N Blanche Ave SW
- 17 Crestwood Dr SW
- 3 Grover St SW
- 410 Hardy Ave SW
- 0 Featherston Rd SW Unit 13890394
- 0 Featherston Rd SW Unit 10512723
- 88 Watson Dr SW
- 515 Harper Ave SW
- 107 Butler St SW
- 112 Blacks Bluff Rd SW
- 109 Blacks Bluff Rd SW
- 114 Blacks Bluff Rd SW
- 113 Blacks Bluff Rd SW
- 116 Blacks Bluff Rd SW
- 38 Blacks Bluff Rd SW
- 120 Blacks Bluff Rd SW
- 117 Blacks Bluff Rd SW
- 36 Blacks Bluff Rd SW
- 107 Blacks Bluff Rd SW
- 37 Blacks Bluff Rd SW
- 122 Blacks Bluff Rd SW
- 119 Blacks Bluff Rd SW
- 34 Blacks Bluff Rd SW
- 34 Blacks Bluff Rd SW
- 35 Blacks Bluff Rd SW
- 124 Blacks Bluff Rd SW
- 1917 Blacks Bluff Rd SW
- 33 Blacks Bluff Rd SW
- 30 Blacks Bluff Rd SW