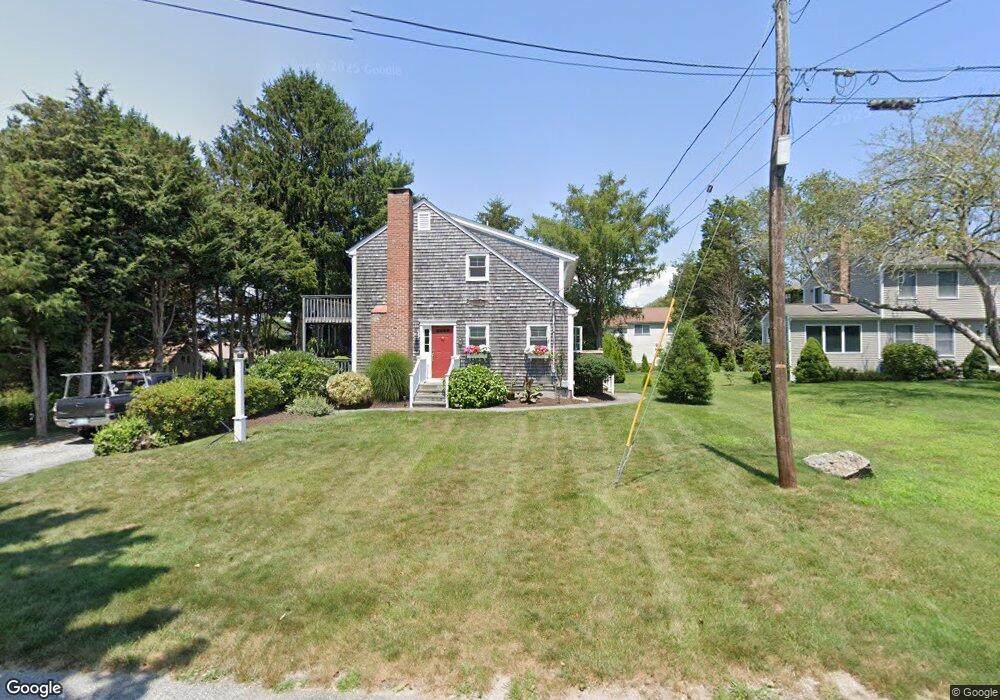
108 Bow St Jamestown, RI 02835
Jamestown Shores NeighborhoodEstimated Value: $794,173 - $1,084,000
2
Beds
2
Baths
1,712
Sq Ft
$557/Sq Ft
Est. Value
About This Home
This home is located at 108 Bow St, Jamestown, RI 02835 and is currently estimated at $953,293, approximately $556 per square foot. 108 Bow St is a home located in Newport County with nearby schools including Melrose Avenue School and Lawn Avenue School.
Ownership History
Date
Name
Owned For
Owner Type
Purchase Details
Closed on
Apr 24, 1998
Sold by
Peterson Carol A
Bought by
Stanford John D and Stanford Karen
Current Estimated Value
Home Financials for this Owner
Home Financials are based on the most recent Mortgage that was taken out on this home.
Original Mortgage
$133,600
Outstanding Balance
$23,064
Interest Rate
7.08%
Estimated Equity
$930,229
Create a Home Valuation Report for This Property
The Home Valuation Report is an in-depth analysis detailing your home's value as well as a comparison with similar homes in the area
Home Values in the Area
Average Home Value in this Area
Purchase History
| Date | Buyer | Sale Price | Title Company |
|---|---|---|---|
| Stanford John D | $167,000 | -- |
Source: Public Records
Mortgage History
| Date | Status | Borrower | Loan Amount |
|---|---|---|---|
| Open | Stanford John D | $18,680 | |
| Open | Stanford John D | $133,600 | |
| Closed | Stanford John D | $133,600 |
Source: Public Records
Tax History
| Year | Tax Paid | Tax Assessment Tax Assessment Total Assessment is a certain percentage of the fair market value that is determined by local assessors to be the total taxable value of land and additions on the property. | Land | Improvement |
|---|---|---|---|---|
| 2025 | $3,628 | $643,300 | $194,600 | $448,700 |
| 2024 | $3,262 | $454,900 | $147,400 | $307,500 |
| 2023 | $3,176 | $455,000 | $147,400 | $307,600 |
| 2022 | $3,089 | $455,000 | $147,400 | $307,600 |
| 2021 | $3,094 | $373,700 | $134,500 | $239,200 |
| 2020 | $3,007 | $372,600 | $134,500 | $238,100 |
| 2019 | $2,999 | $372,600 | $134,500 | $238,100 |
| 2018 | $2,936 | $331,800 | $120,700 | $211,100 |
| 2017 | $2,873 | $331,800 | $120,700 | $211,100 |
| 2016 | $2,847 | $331,800 | $120,700 | $211,100 |
| 2015 | $2,691 | $306,500 | $141,100 | $165,400 |
| 2014 | $2,682 | $306,500 | $141,100 | $165,400 |
Source: Public Records
Map
Nearby Homes
- 121 Seaside Dr
- 174 Seaside Dr
- 10 Coulter St
- 48 Ocean Ave
- 30 W Bay View Dr
- 63 Pemberton Ave
- 127 Longfellow Rd
- 46 North Rd
- 63 Longfellow Rd
- 31 Buloid Ave
- 78 Narragansett Ave
- 24 Southwest Ave
- 22 Southwest Ave
- 73 Conanicus Ave Unit 4
- 14 Clinton Ave
- 22 Cole St
- 104 Howland Ave
- 30 Walcott Ave
- 777 E Shore Rd
- 9 Parsley Ln
Your Personal Tour Guide
Ask me questions while you tour the home.