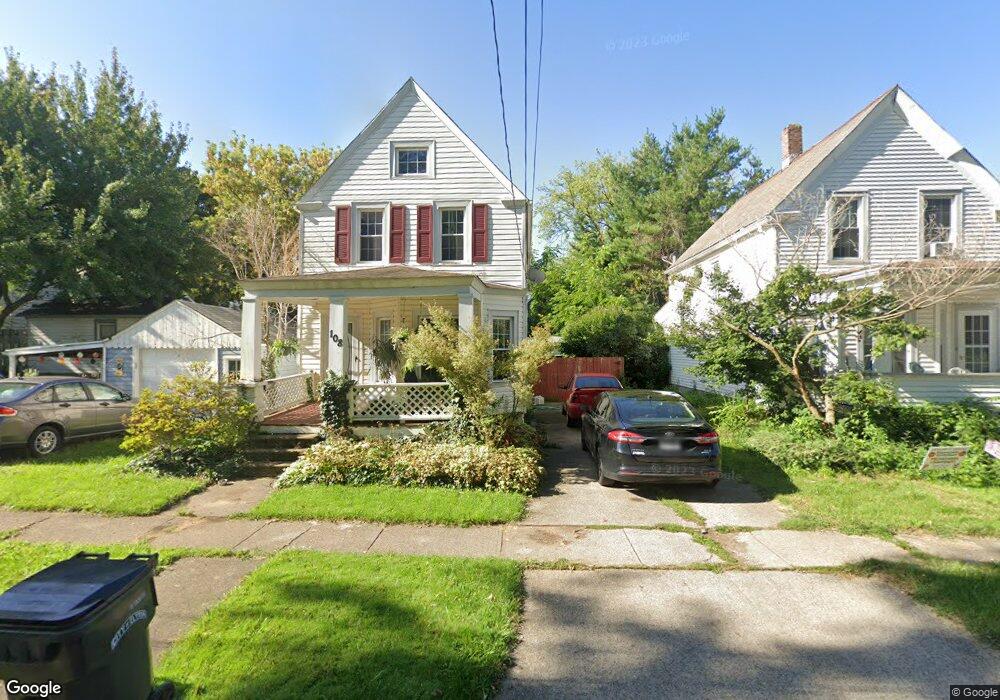
108 Chase St Elyria, OH 44035
Estimated Value: $116,997 - $154,000
3
Beds
1
Bath
1,076
Sq Ft
$119/Sq Ft
Est. Value
About This Home
This home is located at 108 Chase St, Elyria, OH 44035 and is currently estimated at $127,749, approximately $118 per square foot. 108 Chase St is a home located in Lorain County with nearby schools including Eastern Heights Middle School, Elyria High School, and Constellation Schools: Elyria Community Elementary.
Ownership History
Date
Name
Owned For
Owner Type
Purchase Details
Closed on
May 21, 2010
Sold by
Britton Kevin S
Bought by
Britton Brooke M
Current Estimated Value
Purchase Details
Closed on
Sep 9, 2005
Sold by
Thompson Steven E and Thompson Stephanie L
Bought by
Britton Kevin and Britton Brooke
Home Financials for this Owner
Home Financials are based on the most recent Mortgage that was taken out on this home.
Original Mortgage
$98,900
Outstanding Balance
$53,045
Interest Rate
5.89%
Mortgage Type
Purchase Money Mortgage
Estimated Equity
$74,704
Purchase Details
Closed on
Sep 11, 1995
Sold by
Mittler Douglas J
Bought by
Thompson Steven E and Thompson Stephaine L
Home Financials for this Owner
Home Financials are based on the most recent Mortgage that was taken out on this home.
Original Mortgage
$62,600
Interest Rate
7.76%
Mortgage Type
New Conventional
Create a Home Valuation Report for This Property
The Home Valuation Report is an in-depth analysis detailing your home's value as well as a comparison with similar homes in the area
Home Values in the Area
Average Home Value in this Area
Purchase History
| Date | Buyer | Sale Price | Title Company |
|---|---|---|---|
| Britton Brooke M | -- | Attorney | |
| Britton Kevin | $98,900 | -- | |
| Thompson Steven E | $65,900 | -- |
Source: Public Records
Mortgage History
| Date | Status | Borrower | Loan Amount |
|---|---|---|---|
| Open | Britton Kevin | $98,900 | |
| Previous Owner | Thompson Steven E | $62,600 |
Source: Public Records
Tax History
| Year | Tax Paid | Tax Assessment Tax Assessment Total Assessment is a certain percentage of the fair market value that is determined by local assessors to be the total taxable value of land and additions on the property. | Land | Improvement |
|---|---|---|---|---|
| 2024 | $1,653 | $34,409 | $3,325 | $31,084 |
| 2023 | $1,540 | $27,521 | $2,517 | $25,004 |
| 2022 | $1,527 | $27,521 | $2,517 | $25,004 |
| 2021 | $1,522 | $27,521 | $2,517 | $25,004 |
| 2020 | $1,473 | $23,540 | $2,150 | $21,390 |
| 2019 | $1,464 | $23,540 | $2,150 | $21,390 |
| 2018 | $1,645 | $23,540 | $2,150 | $21,390 |
| 2017 | $1,808 | $28,450 | $2,360 | $26,090 |
| 2016 | $1,784 | $28,450 | $2,360 | $26,090 |
| 2015 | $1,671 | $28,450 | $2,360 | $26,090 |
| 2014 | $1,635 | $28,170 | $2,340 | $25,830 |
| 2013 | $1,619 | $28,170 | $2,340 | $25,830 |
Source: Public Records
Map
Nearby Homes
Your Personal Tour Guide
Ask me questions while you tour the home.