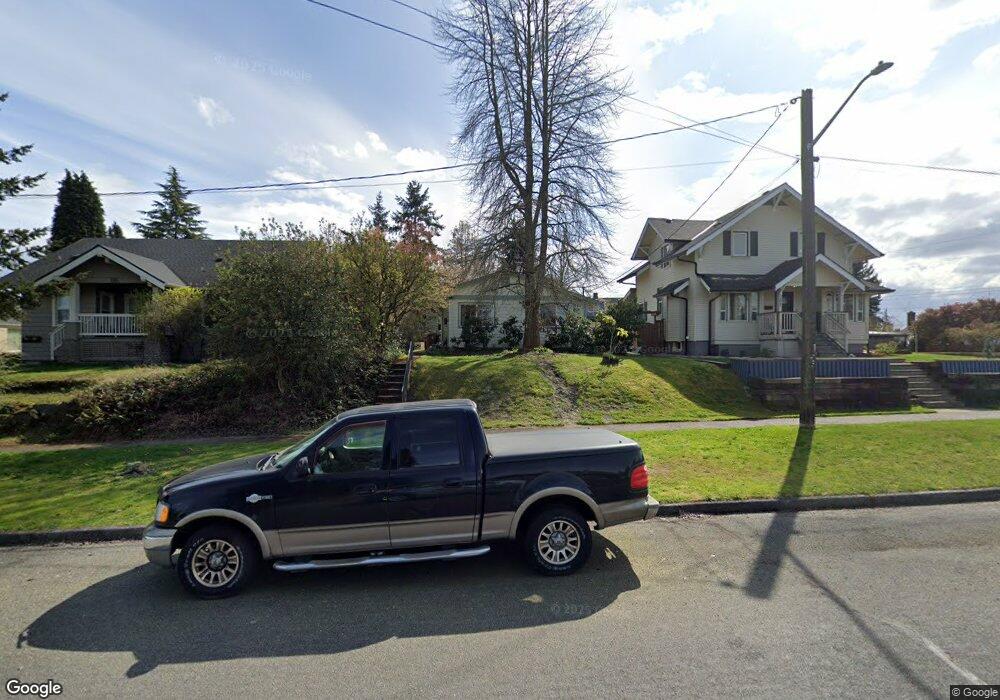
108 E 40th St Tacoma, WA 98404
Eastside NeighborhoodEstimated Value: $353,000 - $416,000
3
Beds
1
Bath
1,004
Sq Ft
$384/Sq Ft
Est. Value
About This Home
This home is located at 108 E 40th St, Tacoma, WA 98404 and is currently estimated at $385,983, approximately $384 per square foot. 108 E 40th St is a home located in Pierce County with nearby schools including Lyon, Hunt Middle School, and Lincoln High School.
Ownership History
Date
Name
Owned For
Owner Type
Purchase Details
Closed on
Apr 28, 2003
Sold by
Udall William N
Bought by
Jones Jennifer A
Current Estimated Value
Home Financials for this Owner
Home Financials are based on the most recent Mortgage that was taken out on this home.
Original Mortgage
$90,000
Outstanding Balance
$38,916
Interest Rate
5.72%
Mortgage Type
Seller Take Back
Estimated Equity
$347,067
Purchase Details
Closed on
Dec 10, 2002
Sold by
Boicourt Maurice W
Bought by
Udall William N
Create a Home Valuation Report for This Property
The Home Valuation Report is an in-depth analysis detailing your home's value as well as a comparison with similar homes in the area
Home Values in the Area
Average Home Value in this Area
Purchase History
| Date | Buyer | Sale Price | Title Company |
|---|---|---|---|
| Jones Jennifer A | $90,000 | Commonwealth Title Co | |
| Udall William N | $86,635 | Commonwealth Title Co |
Source: Public Records
Mortgage History
| Date | Status | Borrower | Loan Amount |
|---|---|---|---|
| Open | Jones Jennifer A | $90,000 |
Source: Public Records
Tax History Compared to Growth
Tax History
| Year | Tax Paid | Tax Assessment Tax Assessment Total Assessment is a certain percentage of the fair market value that is determined by local assessors to be the total taxable value of land and additions on the property. | Land | Improvement |
|---|---|---|---|---|
| 2025 | $3,570 | $354,700 | $188,400 | $166,300 |
| 2024 | $3,570 | $338,000 | $178,000 | $160,000 |
| 2023 | $3,570 | $320,400 | $169,300 | $151,100 |
| 2022 | $3,321 | $342,500 | $176,300 | $166,200 |
| 2021 | $2,929 | $232,700 | $104,900 | $127,800 |
| 2019 | $2,402 | $208,700 | $87,700 | $121,000 |
| 2018 | $2,430 | $184,500 | $70,500 | $114,000 |
| 2017 | $2,147 | $153,600 | $58,800 | $94,800 |
| 2016 | $1,851 | $113,300 | $43,500 | $69,800 |
| 2014 | $1,626 | $106,300 | $42,900 | $63,400 |
| 2013 | $1,626 | $96,200 | $37,600 | $58,600 |
Source: Public Records
Map
Nearby Homes
- 4015 S Bell St
- 4050 E B St
- 3807 A St
- 3718 Pacific Ave
- 3635 S A St
- 4026 Fawcett Ave
- 4055 E F St
- 4508 S D St
- 4309 Tacoma Ave S Unit 3
- 4309 Tacoma Ave S Unit 2
- 4309 Tacoma Ave S Unit 1
- 4309 Tacoma Ave S Unit 1,2,3
- 4050 E G St
- 201 E 36th St
- 3837 E G St
- 4631 Pacific Ave
- 4317 S G St
- 3824 S G St
- 714 S 43rd St
- 223 S 48th St