Estimated Value: $211,000 - $245,000
--
Bed
--
Bath
--
Sq Ft
--
Built
About This Home
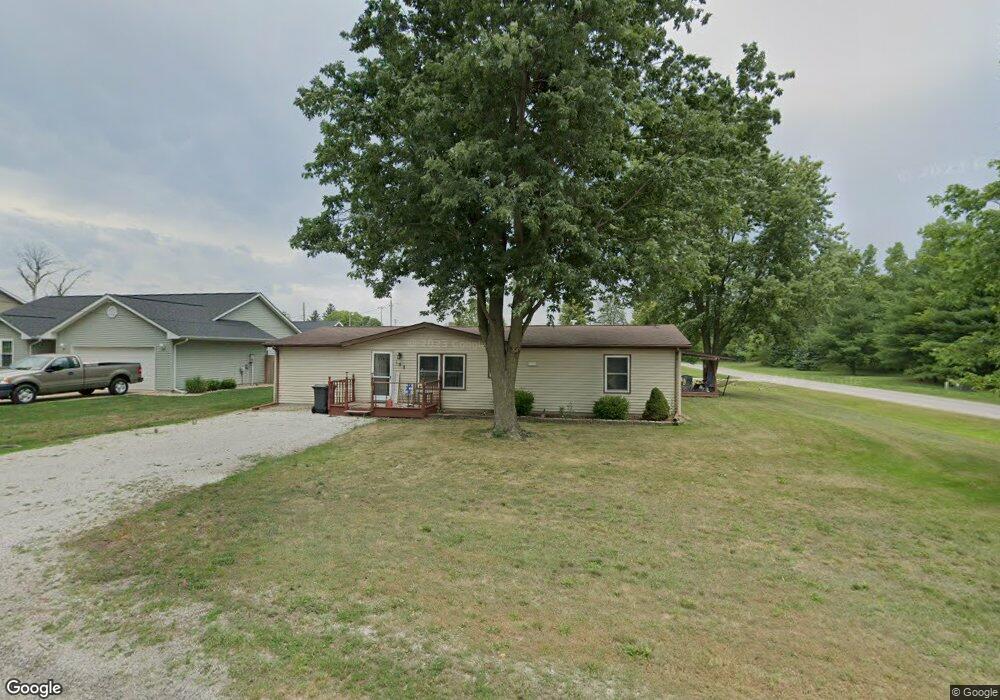
This home is located at 108 E Tyler St, Philo, IL 61864 and is currently estimated at $222,196. 108 E Tyler St is a home located in Champaign County with nearby schools including Unity High School and St. Thomas Catholic Elementary School.
Ownership History
Date
Name
Owned For
Owner Type
Purchase Details
Closed on
Nov 23, 2024
Sold by
Schweighart Tyler and Schweighart Brittany
Bought by
Koeberlein Janelle and Koeberlein Charles
Current Estimated Value
Home Financials for this Owner
Home Financials are based on the most recent Mortgage that was taken out on this home.
Original Mortgage
$139,995
Outstanding Balance
$138,668
Interest Rate
6.38%
Mortgage Type
New Conventional
Estimated Equity
$83,528
Purchase Details
Closed on
May 29, 2024
Sold by
Sigler Ronald E and Sigler Debbie
Bought by
Schweighart Tyler and Schweighart Brittany
Home Financials for this Owner
Home Financials are based on the most recent Mortgage that was taken out on this home.
Original Mortgage
$93,500
Interest Rate
6.32%
Mortgage Type
New Conventional
Purchase Details
Closed on
Aug 14, 2020
Sold by
Collins Clarence Leland and Sigler Ronald E
Bought by
Collins Clarence Leland
Create a Home Valuation Report for This Property
The Home Valuation Report is an in-depth analysis detailing your home's value as well as a comparison with similar homes in the area
Purchase History
| Date | Buyer | Sale Price | Title Company |
|---|---|---|---|
| Koeberlein Janelle | $200,000 | None Listed On Document | |
| Koeberlein Janelle | $200,000 | None Listed On Document | |
| Schweighart Tyler | $75,000 | None Listed On Document | |
| Schweighart Tyler | $75,000 | None Listed On Document | |
| Collins Clarence Leland | -- | None Available |
Source: Public Records
Mortgage History
| Date | Status | Borrower | Loan Amount |
|---|---|---|---|
| Open | Koeberlein Janelle | $139,995 | |
| Closed | Koeberlein Janelle | $139,995 | |
| Previous Owner | Schweighart Tyler | $93,500 |
Source: Public Records
Tax History
| Year | Tax Paid | Tax Assessment Tax Assessment Total Assessment is a certain percentage of the fair market value that is determined by local assessors to be the total taxable value of land and additions on the property. | Land | Improvement |
|---|---|---|---|---|
| 2024 | $1,931 | $42,300 | $5,380 | $36,920 |
| 2023 | $1,931 | $39,210 | $4,990 | $34,220 |
| 2022 | $1,831 | $36,820 | $4,690 | $32,130 |
| 2021 | $1,740 | $34,960 | $4,450 | $30,510 |
| 2020 | $2,240 | $34,200 | $4,350 | $29,850 |
| 2019 | $1,775 | $32,720 | $4,160 | $28,560 |
| 2018 | $1,324 | $31,610 | $4,020 | $27,590 |
| 2017 | $1,653 | $30,070 | $3,820 | $26,250 |
| 2016 | $1,593 | $28,940 | $3,680 | $25,260 |
| 2015 | $1,723 | $28,210 | $3,590 | $24,620 |
| 2014 | $1,686 | $27,680 | $3,520 | $24,160 |
| 2013 | $1,699 | $27,680 | $3,520 | $24,160 |
Source: Public Records
Map
Nearby Homes
- 302 N Jackson St
- 103 W Jefferson St
- 707 Country View Dr
- 515 Valley View Dr Unit 3
- 11 Kennedy Ct
- 610 E Roosevelt Rd
- 413 W Main St
- 106 S Eldorado St
- 407 S Washington St
- 1611 E Vernon Dr
- 1605 E Vernon Dr
- 3402 Melissa Ln
- 3312 Melissa Ln
- 1806 Trails Dr
- 508 Silver Lake Ct
- 10 Dunlap Woods
- 703 E Washington St
- 108 Shiloh Dr
- 1809 Galena St
- 2902 S Myra Ridge Dr
- 106 E Tyler St
- 104 E Tyler St
- 105 E Fillmore St
- 105 E Tyler St
- 103 E Fillmore St
- 302 N Harrison St
- 103 E Tyler St
- 101 E Fillmore St
- 208 N Harrison St
- 301 N Harrison St
- 202 N Harrison St
- 207 N Harrison St
- 207 N Harrison St
- 307 N Harrison St
- 104 W Tyler St
- 401 N Harrison St
- 103 W Fillmore St
- 102 W Grant St
- 104 W Grant St
- 105 W Fillmore St
Your Personal Tour Guide
Ask me questions while you tour the home.