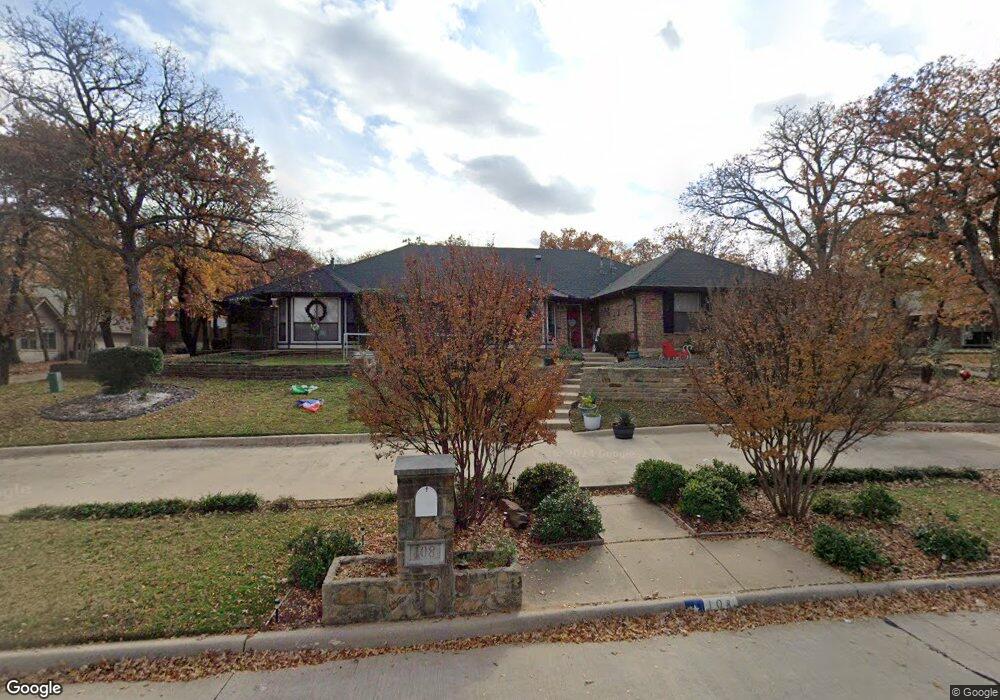
108 El Paseo St Denton, TX 76205
South Denton NeighborhoodEstimated Value: $587,993 - $628,000
4
Beds
3
Baths
3,122
Sq Ft
$195/Sq Ft
Est. Value
About This Home
This home is located at 108 El Paseo St, Denton, TX 76205 and is currently estimated at $608,248, approximately $194 per square foot. 108 El Paseo St is a home located in Denton County with nearby schools including Ryan Elementary School, McMath Middle School, and Denton High School.
Ownership History
Date
Name
Owned For
Owner Type
Purchase Details
Closed on
Jun 12, 2013
Sold by
Davis Judith A and Davis Doyle Bradley
Bought by
Gonzales Laura A
Current Estimated Value
Home Financials for this Owner
Home Financials are based on the most recent Mortgage that was taken out on this home.
Original Mortgage
$241,200
Outstanding Balance
$170,732
Interest Rate
3.38%
Mortgage Type
New Conventional
Estimated Equity
$437,516
Purchase Details
Closed on
Dec 29, 1999
Sold by
Henderson John E and Henderson Deborah A
Bought by
Davis Doyle A and Davis Judith A
Home Financials for this Owner
Home Financials are based on the most recent Mortgage that was taken out on this home.
Original Mortgage
$60,000
Interest Rate
7.69%
Purchase Details
Closed on
Aug 28, 1998
Sold by
Macintosh K Vici
Bought by
Henderson John E and Henderson Deborah A
Home Financials for this Owner
Home Financials are based on the most recent Mortgage that was taken out on this home.
Original Mortgage
$123,500
Interest Rate
6.9%
Create a Home Valuation Report for This Property
The Home Valuation Report is an in-depth analysis detailing your home's value as well as a comparison with similar homes in the area
Home Values in the Area
Average Home Value in this Area
Purchase History
| Date | Buyer | Sale Price | Title Company |
|---|---|---|---|
| Gonzales Laura A | -- | Title Resources | |
| Davis Doyle A | -- | -- | |
| Henderson John E | -- | -- |
Source: Public Records
Mortgage History
| Date | Status | Borrower | Loan Amount |
|---|---|---|---|
| Open | Gonzales Laura A | $241,200 | |
| Previous Owner | Davis Doyle A | $60,000 | |
| Previous Owner | Henderson John E | $123,500 |
Source: Public Records
Tax History Compared to Growth
Tax History
| Year | Tax Paid | Tax Assessment Tax Assessment Total Assessment is a certain percentage of the fair market value that is determined by local assessors to be the total taxable value of land and additions on the property. | Land | Improvement |
|---|---|---|---|---|
| 2025 | $8,001 | $517,000 | $148,262 | $368,738 |
| 2024 | $9,197 | $476,498 | $0 | $0 |
| 2023 | $7,074 | $433,180 | $145,026 | $383,974 |
| 2022 | $8,360 | $393,800 | $107,078 | $345,922 |
| 2021 | $7,958 | $358,000 | $88,368 | $269,632 |
| 2020 | $8,206 | $359,000 | $88,368 | $270,632 |
| 2019 | $8,351 | $350,000 | $88,368 | $261,632 |
| 2018 | $7,827 | $324,000 | $88,368 | $235,632 |
| 2017 | $7,627 | $308,550 | $61,857 | $256,727 |
| 2016 | $7,037 | $280,500 | $61,857 | $231,241 |
| 2015 | $6,440 | $255,000 | $61,857 | $193,143 |
| 2013 | -- | $240,915 | $61,857 | $179,058 |
Source: Public Records
Map
Nearby Homes
- 9 Oak Forrest Cir
- 33 Oak Forrest Cir
- 100 Bentwood Ct
- 21 Wellington Oaks Cir
- 28 Timbergreen Cir
- 409 Meadowlands Dr
- 9 Royal Oaks Cir
- 3309 Del Mar Dr
- 3109 Forrestridge Dr
- 3200 Belmont St
- 301 Fairmount Ct
- 39 Highview Cir
- Type - 2 Plan at Ryan Woods
- 3601 Montecito Dr
- 3916 Maggies Meadow
- 400 Regency Ct
- 3612 Granada Trail
- 4100 Willow Grove Ave
- 3805 Granada Trail
- 3108 Pinehurst Ct
- 200 El Paseo St
- 104 El Paseo St
- 17 Oak Forrest Cir
- 15 Oak Forrest Cir
- 204 El Paseo St
- 107 El Paseo St
- 19 Oak Forrest Cir
- 100 El Paseo St
- 13 Oak Forrest Cir
- 201 El Paseo St
- 103 El Paseo St
- 205 El Paseo St
- 208 El Paseo St
- 11 Oak Forrest Cir
- 101 El Paseo St
- 21 Oak Forrest Cir
- 105 W El Paseo St
- 207 El Paseo St
- 18 Oak Forrest Cir
- 30 Rolling Hills Cir