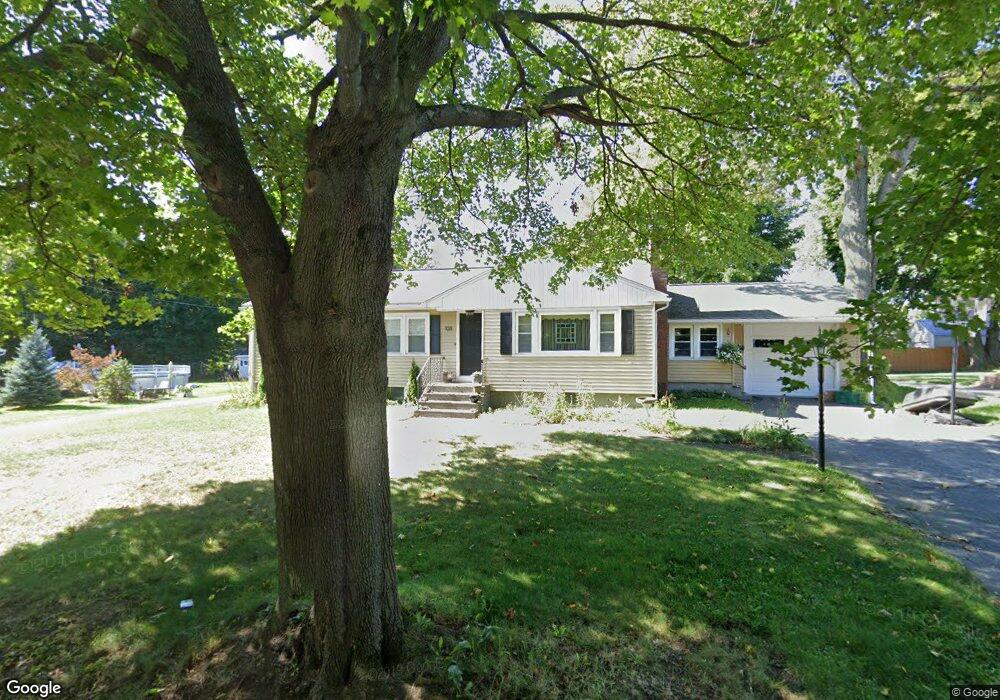
108 Epworth St Worcester, MA 01610
North Quinsigamond Village NeighborhoodEstimated Value: $357,000 - $455,111
3
Beds
2
Baths
1,340
Sq Ft
$310/Sq Ft
Est. Value
About This Home
This home is located at 108 Epworth St, Worcester, MA 01610 and is currently estimated at $415,028, approximately $309 per square foot. 108 Epworth St is a home located in Worcester County with nearby schools including Quinsigamond School, Jacob Hiatt Magnet School, and Chandler Magnet.
Ownership History
Date
Name
Owned For
Owner Type
Purchase Details
Closed on
Dec 6, 2007
Sold by
Ocwen Loan Servicing L
Bought by
Cuddeback Jaime A
Current Estimated Value
Home Financials for this Owner
Home Financials are based on the most recent Mortgage that was taken out on this home.
Original Mortgage
$185,200
Outstanding Balance
$117,648
Interest Rate
6.37%
Mortgage Type
Purchase Money Mortgage
Estimated Equity
$297,380
Purchase Details
Closed on
Aug 14, 2007
Sold by
Moores John
Bought by
Hsbc Bank Usa
Purchase Details
Closed on
Nov 29, 2004
Sold by
Mcmanus Martin S and Mcmanus Olive J
Bought by
Moores John and Moores Sheri
Home Financials for this Owner
Home Financials are based on the most recent Mortgage that was taken out on this home.
Original Mortgage
$224,800
Interest Rate
5.75%
Mortgage Type
Purchase Money Mortgage
Create a Home Valuation Report for This Property
The Home Valuation Report is an in-depth analysis detailing your home's value as well as a comparison with similar homes in the area
Home Values in the Area
Average Home Value in this Area
Purchase History
| Date | Buyer | Sale Price | Title Company |
|---|---|---|---|
| Cuddeback Jaime A | $195,000 | -- | |
| Hsbc Bank Usa | $249,769 | -- | |
| Moores John | $281,000 | -- |
Source: Public Records
Mortgage History
| Date | Status | Borrower | Loan Amount |
|---|---|---|---|
| Open | Cuddeback Jaime A | $185,200 | |
| Previous Owner | Moores John | $224,800 |
Source: Public Records
Tax History Compared to Growth
Tax History
| Year | Tax Paid | Tax Assessment Tax Assessment Total Assessment is a certain percentage of the fair market value that is determined by local assessors to be the total taxable value of land and additions on the property. | Land | Improvement |
|---|---|---|---|---|
| 2025 | $5,078 | $385,000 | $119,200 | $265,800 |
| 2024 | $4,972 | $361,600 | $119,200 | $242,400 |
| 2023 | $4,811 | $335,500 | $103,600 | $231,900 |
| 2022 | $4,236 | $281,000 | $82,900 | $198,100 |
| 2021 | $4,236 | $260,200 | $66,300 | $193,900 |
| 2020 | $4,068 | $239,300 | $66,300 | $173,000 |
| 2019 | $3,830 | $212,800 | $59,900 | $152,900 |
| 2018 | $3,712 | $196,300 | $59,900 | $136,400 |
| 2017 | $3,761 | $195,700 | $59,900 | $135,800 |
| 2016 | $3,708 | $179,900 | $45,000 | $134,900 |
| 2015 | $3,611 | $179,900 | $45,000 | $134,900 |
| 2014 | $3,515 | $179,900 | $45,000 | $134,900 |
Source: Public Records
Map
Nearby Homes