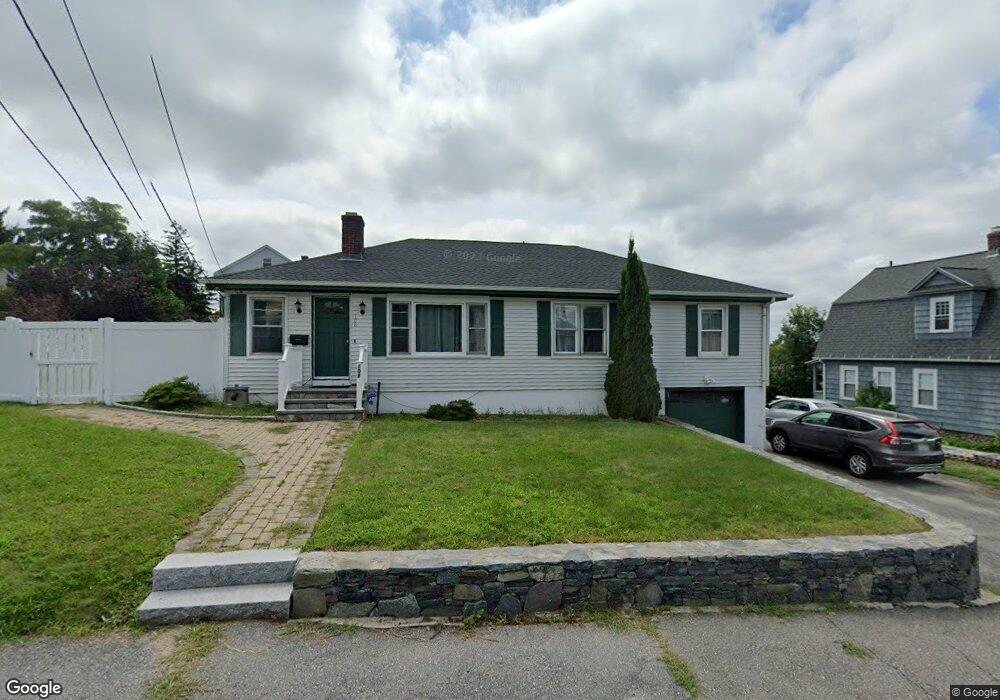
108 Francis St Worcester, MA 01606
Greendale NeighborhoodEstimated Value: $419,000 - $484,484
3
Beds
2
Baths
1,392
Sq Ft
$323/Sq Ft
Est. Value
About This Home
This home is located at 108 Francis St, Worcester, MA 01606 and is currently estimated at $449,871, approximately $323 per square foot. 108 Francis St is a home located in Worcester County with nearby schools including Jacob Hiatt Magnet School, Chandler Magnet, and Thorndyke Road School.
Ownership History
Date
Name
Owned For
Owner Type
Purchase Details
Closed on
Oct 29, 2008
Sold by
Citimortgage Inc
Bought by
Carvalho Jessica M and Carvalho Leonardo D
Current Estimated Value
Home Financials for this Owner
Home Financials are based on the most recent Mortgage that was taken out on this home.
Original Mortgage
$149,400
Outstanding Balance
$96,030
Interest Rate
5.83%
Mortgage Type
Purchase Money Mortgage
Estimated Equity
$353,841
Purchase Details
Closed on
Apr 24, 2008
Sold by
Stearns Carol I
Bought by
Citimortgage Inc
Purchase Details
Closed on
Sep 21, 1998
Sold by
Lemoine Flora M and Lemoine Ricahrd C
Bought by
Stearns David K and Stearns Carol I
Home Financials for this Owner
Home Financials are based on the most recent Mortgage that was taken out on this home.
Original Mortgage
$131,737
Interest Rate
6.9%
Mortgage Type
Purchase Money Mortgage
Purchase Details
Closed on
Jun 20, 1994
Sold by
Ottaviano Michael A and Ottaviano Patricia
Bought by
Lemoine Richard and Lemoine Flora
Create a Home Valuation Report for This Property
The Home Valuation Report is an in-depth analysis detailing your home's value as well as a comparison with similar homes in the area
Home Values in the Area
Average Home Value in this Area
Purchase History
| Date | Buyer | Sale Price | Title Company |
|---|---|---|---|
| Carvalho Jessica M | $166,000 | -- | |
| Citimortgage Inc | $170,421 | -- | |
| Stearns David K | $133,000 | -- | |
| Lemoine Richard | $116,500 | -- |
Source: Public Records
Mortgage History
| Date | Status | Borrower | Loan Amount |
|---|---|---|---|
| Open | Carvalho Jessica M | $149,400 | |
| Previous Owner | Lemoine Richard | $131,737 | |
| Previous Owner | Lemoine Richard | $106,200 |
Source: Public Records
Tax History Compared to Growth
Tax History
| Year | Tax Paid | Tax Assessment Tax Assessment Total Assessment is a certain percentage of the fair market value that is determined by local assessors to be the total taxable value of land and additions on the property. | Land | Improvement |
|---|---|---|---|---|
| 2025 | $5,368 | $407,000 | $118,800 | $288,200 |
| 2024 | $5,254 | $382,100 | $118,800 | $263,300 |
| 2023 | $5,099 | $355,600 | $103,300 | $252,300 |
| 2022 | $4,551 | $299,200 | $82,700 | $216,500 |
| 2021 | $4,568 | $280,600 | $66,200 | $214,400 |
| 2020 | $4,386 | $258,000 | $66,100 | $191,900 |
| 2019 | $4,142 | $230,100 | $59,600 | $170,500 |
| 2018 | $4,024 | $212,800 | $59,600 | $153,200 |
| 2017 | $4,090 | $212,800 | $59,600 | $153,200 |
| 2016 | $4,044 | $196,200 | $44,000 | $152,200 |
| 2015 | $3,938 | $196,200 | $44,000 | $152,200 |
| 2014 | $3,834 | $196,200 | $44,000 | $152,200 |
Source: Public Records
Map
Nearby Homes
- 43 Fales St
- 40 Francis St
- 314 Burncoat St
- 14 Fales St
- 18 Claffey Ave
- 3 Granville Ave
- 15 Inwood Rd
- 80 Clark St
- 134 Whitmarsh Ave
- 68 Housatonic St
- 29 E Mountain
- 14 Housatonic St
- 28 Brooks St
- 95 Saint Nicholas Ave
- 34 King Philip Rd
- 48 Wilkinson St
- 126 Brooks St
- 113 Bay State Rd
- 12 Prudential Rd
- 120 Bay State Rd
- 112 Francis St
- 111 Fairhaven Rd
- 115 Fairhaven Rd
- 100 Francis St
- 114 Francis St
- 107 Fairhaven Rd
- 119 Fairhaven Rd
- 103 Francis St
- 107 Francis St
- 103 Fairhaven Rd
- 123 Fairhaven Rd
- 118 Francis St
- 99 Francis St
- 109 Francis St
- 92 Francis St
- 127 Fairhaven Rd
- 99 Fairhaven Rd
- 115 Francis St
- 122 Francis St
- 114 Fairhaven Rd