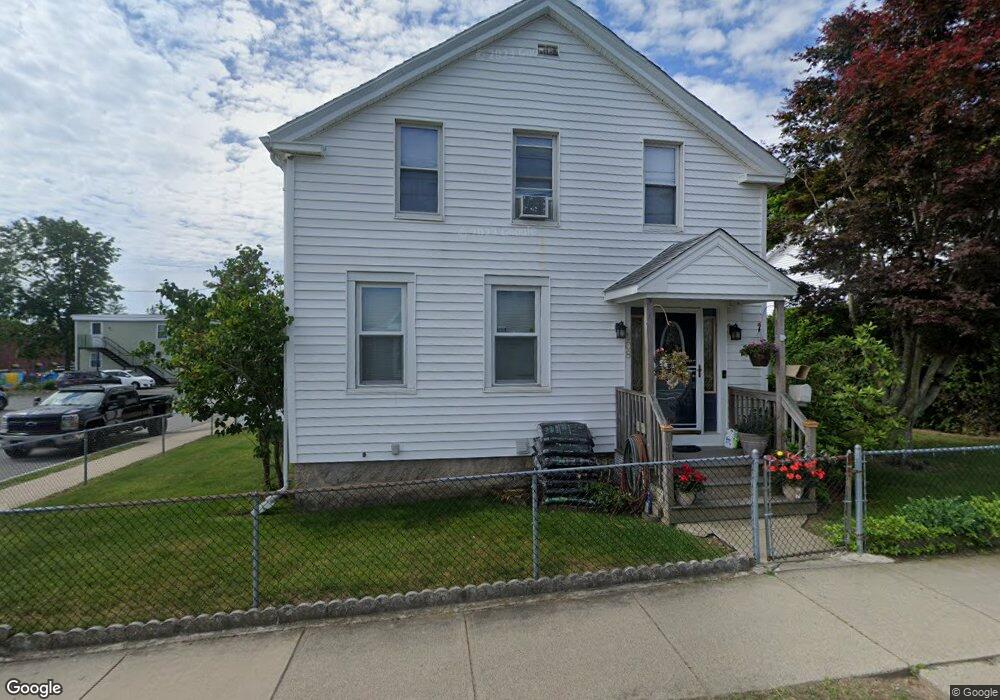
108 Grape St New Bedford, MA 02740
The South End NeighborhoodEstimated Value: $532,000 - $595,000
4
Beds
4
Baths
2,285
Sq Ft
$242/Sq Ft
Est. Value
About This Home
This home is located at 108 Grape St, New Bedford, MA 02740 and is currently estimated at $551,921, approximately $241 per square foot. 108 Grape St is a home located in Bristol County with nearby schools including Betsey B. Winslow Elementary School, Keith Middle School, and New Bedford High School.
Ownership History
Date
Name
Owned For
Owner Type
Purchase Details
Closed on
Oct 2, 2024
Sold by
Oliveira Frank J and Oliveira Maria C
Bought by
Oliveira Frank J and Oliveira Maria C
Current Estimated Value
Purchase Details
Closed on
Nov 18, 1992
Sold by
Lewis John W E Est
Bought by
Olineira Frank J and Perreira Maraia C
Purchase Details
Closed on
Dec 22, 1988
Sold by
Lewis John W E
Bought by
Delgaro Devel Corp Inc
Create a Home Valuation Report for This Property
The Home Valuation Report is an in-depth analysis detailing your home's value as well as a comparison with similar homes in the area
Home Values in the Area
Average Home Value in this Area
Purchase History
| Date | Buyer | Sale Price | Title Company |
|---|---|---|---|
| Oliveira Frank J | -- | None Available | |
| Oliveira Frank J | -- | None Available | |
| Oliveira Frank J | -- | None Available | |
| Olineira Frank J | $72,000 | -- | |
| Olineira Frank J | $72,000 | -- | |
| Delgaro Devel Corp Inc | $50,000 | -- |
Source: Public Records
Mortgage History
| Date | Status | Borrower | Loan Amount |
|---|---|---|---|
| Previous Owner | Delgaro Devel Corp Inc | $80,000 | |
| Previous Owner | Delgaro Devel Corp Inc | $5,000 | |
| Previous Owner | Delgaro Devel Corp Inc | $64,000 |
Source: Public Records
Tax History Compared to Growth
Tax History
| Year | Tax Paid | Tax Assessment Tax Assessment Total Assessment is a certain percentage of the fair market value that is determined by local assessors to be the total taxable value of land and additions on the property. | Land | Improvement |
|---|---|---|---|---|
| 2025 | $5,183 | $458,300 | $110,100 | $348,200 |
| 2024 | $5,250 | $437,500 | $111,900 | $325,600 |
| 2023 | $5,347 | $374,200 | $96,500 | $277,700 |
| 2022 | $5,033 | $323,900 | $91,800 | $232,100 |
| 2021 | $0 | $312,400 | $91,800 | $220,600 |
| 2020 | $4,669 | $288,900 | $91,800 | $197,100 |
| 2019 | $4,587 | $278,500 | $91,800 | $186,700 |
| 2018 | $151 | $254,600 | $91,800 | $162,800 |
| 2017 | $0 | $235,800 | $91,800 | $144,000 |
| 2016 | $3,742 | $226,900 | $91,800 | $135,100 |
| 2015 | $3,435 | $218,400 | $91,800 | $126,600 |
| 2014 | $3,165 | $208,800 | $86,200 | $122,600 |
Source: Public Records
Map
Nearby Homes