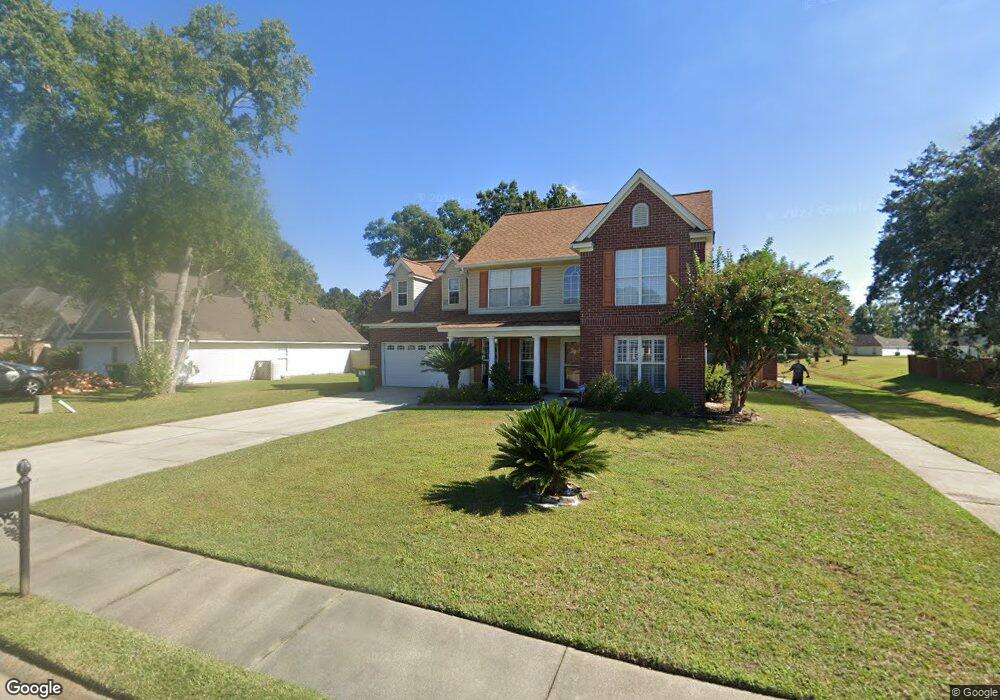
108 Greystone Rd Pooler, GA 31322
Estimated Value: $337,000 - $353,000
3
Beds
2
Baths
2,105
Sq Ft
$164/Sq Ft
Est. Value
About This Home
This home is located at 108 Greystone Rd, Pooler, GA 31322 and is currently estimated at $345,963, approximately $164 per square foot. 108 Greystone Rd is a home located in Chatham County with nearby schools including West Chatham Elementary School, West Chatham Middle School, and New Hampstead High School.
Ownership History
Date
Name
Owned For
Owner Type
Purchase Details
Closed on
May 1, 2025
Sold by
Graham Donna C
Bought by
Bryan John Tr and Graham Donna C Tr
Current Estimated Value
Purchase Details
Closed on
Oct 20, 2014
Sold by
Kane John F
Bought by
Graham Donna C
Purchase Details
Closed on
May 10, 2014
Sold by
Graham Donna C
Bought by
Graham Donna C and Kane John F
Home Financials for this Owner
Home Financials are based on the most recent Mortgage that was taken out on this home.
Original Mortgage
$139,500
Interest Rate
4.37%
Mortgage Type
New Conventional
Purchase Details
Closed on
Aug 9, 2010
Sold by
Kane John F
Bought by
Graham Donna C
Purchase Details
Closed on
Jan 15, 2010
Sold by
Household Finance Corp
Bought by
Kane John F and Graham Donna C
Home Financials for this Owner
Home Financials are based on the most recent Mortgage that was taken out on this home.
Original Mortgage
$149,575
Interest Rate
4.75%
Mortgage Type
FHA
Purchase Details
Closed on
Sep 1, 2009
Sold by
Frazier John D
Bought by
Wells Fargo Bank
Create a Home Valuation Report for This Property
The Home Valuation Report is an in-depth analysis detailing your home's value as well as a comparison with similar homes in the area
Home Values in the Area
Average Home Value in this Area
Purchase History
We collect this data history from publicly available records. To have your information removed, we recommend requesting removal directly through your county’s website.
| Date | Buyer | Sale Price | Title Company |
|---|---|---|---|
| Bryan John Tr | -- | -- | |
| Graham Donna C | -- | -- | |
| Graham Donna C | -- | -- | |
| Graham Donna C | -- | -- | |
| Kane John F | $155,000 | -- | |
| Wells Fargo Bank | $213,177 | -- |
Source: Public Records
Mortgage History
We collect this data history from publicly available records. To have your information removed, we recommend requesting removal directly through your county’s website.
| Date | Status | Borrower | Loan Amount |
|---|---|---|---|
| Previous Owner | Graham Donna C | $139,500 | |
| Previous Owner | Kane John F | $149,575 |
Source: Public Records
Tax History
| Year | Tax Paid | Tax Assessment Tax Assessment Total Assessment is a certain percentage of the fair market value that is determined by local assessors to be the total taxable value of land and additions on the property. | Land | Improvement |
|---|---|---|---|---|
| 2025 | $2,507 | $119,120 | $18,000 | $101,120 |
| 2024 | $18 | $119,680 | $18,000 | $101,680 |
| 2023 | $1,773 | $112,560 | $18,000 | $94,560 |
| 2022 | $2,311 | $93,200 | $12,000 | $81,200 |
| 2021 | $2,325 | $81,200 | $12,000 | $69,200 |
| 2020 | $2,258 | $79,160 | $12,000 | $67,160 |
| 2019 | $2,258 | $78,320 | $12,000 | $66,320 |
| 2018 | $2,235 | $75,800 | $12,000 | $63,800 |
| 2017 | $2,056 | $76,240 | $12,000 | $64,240 |
| 2016 | $1,962 | $66,520 | $12,000 | $54,520 |
| 2015 | $1,996 | $67,240 | $12,000 | $55,240 |
| 2014 | $3,248 | $68,280 | $0 | $0 |
Source: Public Records
Map
Nearby Homes
- 10 Mackinac Ct
- 21 Pebble Rd
- 0 Pine Barren Rd Unit SA351332
- 12 Woodford Reserve Dr
- 6 Coronado Ct
- 171 Holloway Hill
- 119 Holloway Hill
- 174 Holloway Hill
- 126 Holloway Hill
- 167 Holloway Hill
- 151 Holloway Hill
- 127 Timberland Gap Rd
- 186 Silverton Rd
- 111 Golden Gate Dr
- 153 Brooklyn Way
- 5 Gentry St
- 148 Silverton Rd
- 279 Longleaf Cir
- 4 Melody Dr
- 7 Throgs Neck Way
- 106 Greystone Rd
- 2 Deer Walk Rd
- 107 Greystone Rd
- 104 Greystone Rd
- 4 Deer Walk Rd
- 105 Greystone Rd
- 109 Greystone Rd
- 6 Deer Walk Rd
- 103 Greystone Rd
- 102 Greystone Rd
- 111 Greystone Rd
- 101 Greystone Rd
- 108 Legends Rd
- 8 Deer Walk Rd
- 1 Deer Walk Rd
- 106 Legends Rd
- 110 Legends Rd
- 104 Legends Rd Unit 26
- 104 Legends Rd
- 113 Greystone Rd
Your Personal Tour Guide
Ask me questions while you tour the home.