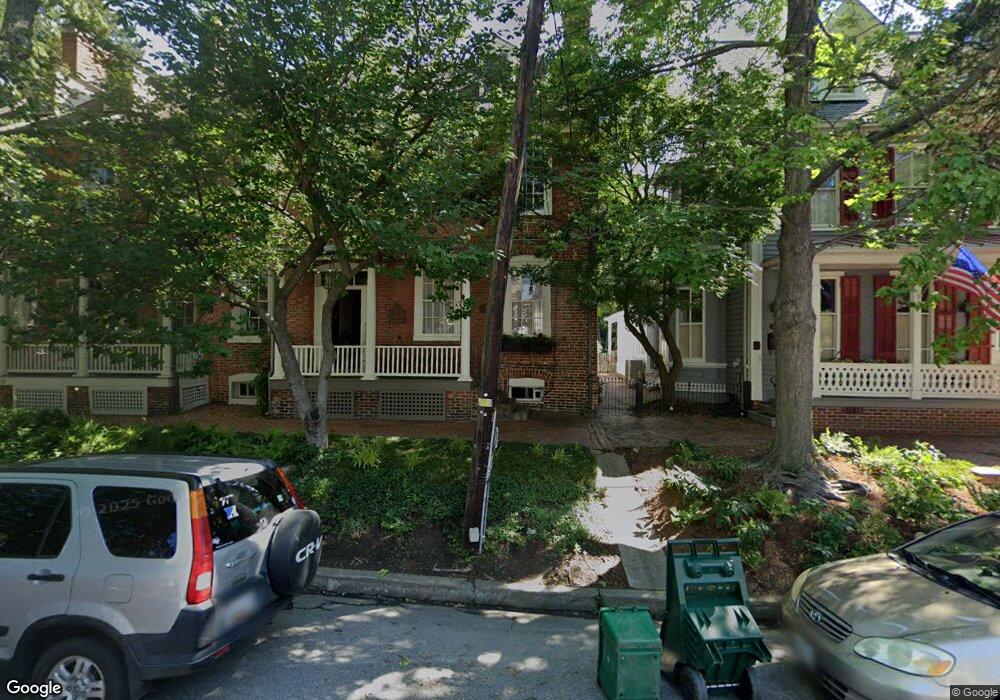
108 High St Chestertown, MD 21620
Estimated Value: $718,000 - $979,000
--
Bed
2
Baths
2,367
Sq Ft
$367/Sq Ft
Est. Value
About This Home
This home is located at 108 High St, Chestertown, MD 21620 and is currently estimated at $868,635, approximately $366 per square foot. 108 High St is a home located in Kent County with nearby schools including Center for Innovation, Kent County Middle School, and Kent County High School.
Ownership History
Date
Name
Owned For
Owner Type
Purchase Details
Closed on
Nov 25, 2024
Sold by
Macdonald Jan
Bought by
Carson Jonna and Graham John P
Current Estimated Value
Home Financials for this Owner
Home Financials are based on the most recent Mortgage that was taken out on this home.
Original Mortgage
$739,500
Outstanding Balance
$733,281
Interest Rate
6.44%
Mortgage Type
New Conventional
Estimated Equity
$135,354
Purchase Details
Closed on
Oct 18, 2021
Sold by
Macdonald Jan
Bought by
Macdonald Jan
Purchase Details
Closed on
Feb 17, 1999
Sold by
Comegys Mary Jeanne
Bought by
O'Neill Richard J and Jan Macdonald
Create a Home Valuation Report for This Property
The Home Valuation Report is an in-depth analysis detailing your home's value as well as a comparison with similar homes in the area
Home Values in the Area
Average Home Value in this Area
Purchase History
| Date | Buyer | Sale Price | Title Company |
|---|---|---|---|
| Carson Jonna | $870,000 | None Listed On Document | |
| Carson Jonna | $870,000 | None Listed On Document | |
| Macdonald Jan | -- | None Available | |
| O'Neill Richard J | $255,000 | -- |
Source: Public Records
Mortgage History
| Date | Status | Borrower | Loan Amount |
|---|---|---|---|
| Open | Carson Jonna | $739,500 | |
| Closed | Carson Jonna | $739,500 |
Source: Public Records
Tax History Compared to Growth
Tax History
| Year | Tax Paid | Tax Assessment Tax Assessment Total Assessment is a certain percentage of the fair market value that is determined by local assessors to be the total taxable value of land and additions on the property. | Land | Improvement |
|---|---|---|---|---|
| 2025 | $9,314 | $594,300 | $252,600 | $341,700 |
| 2024 | $8,927 | $569,633 | $0 | $0 |
| 2023 | $8,102 | $544,967 | $0 | $0 |
| 2022 | $8,102 | $520,300 | $252,600 | $267,700 |
| 2021 | $16,113 | $516,900 | $0 | $0 |
| 2020 | $8,048 | $513,500 | $0 | $0 |
| 2019 | $15,956 | $510,100 | $252,600 | $257,500 |
| 2018 | $7,779 | $510,100 | $252,600 | $257,500 |
| 2017 | $7,059 | $510,100 | $0 | $0 |
| 2016 | -- | $511,300 | $0 | $0 |
| 2015 | $5,729 | $511,300 | $0 | $0 |
| 2014 | $5,729 | $511,300 | $0 | $0 |
Source: Public Records
Map
Nearby Homes
- 105 High St
- 228 S Water St
- 206 S Water St
- 206 Cannon St
- 349 & 351 High St
- 349 High St
- 200 Washington Ave
- 517 High St
- 109 S College Ave
- 0 East St
- 234 N College Ave
- 222 Mount Vernon Ave
- 611 Cannon St
- 423 Calvert St
- 303 E Campus Ave
- 118 Little Harbor Way Unit 202
- 141 Prospect St
- 36 Landing Ln
- 0 Little Harbor Way Unit 1
- 0 Little Harbor Way Unit 1 MDKE2004992