Estimated Value: $117,000 - $129,000
3
Beds
2
Baths
1,325
Sq Ft
$92/Sq Ft
Est. Value
About This Home
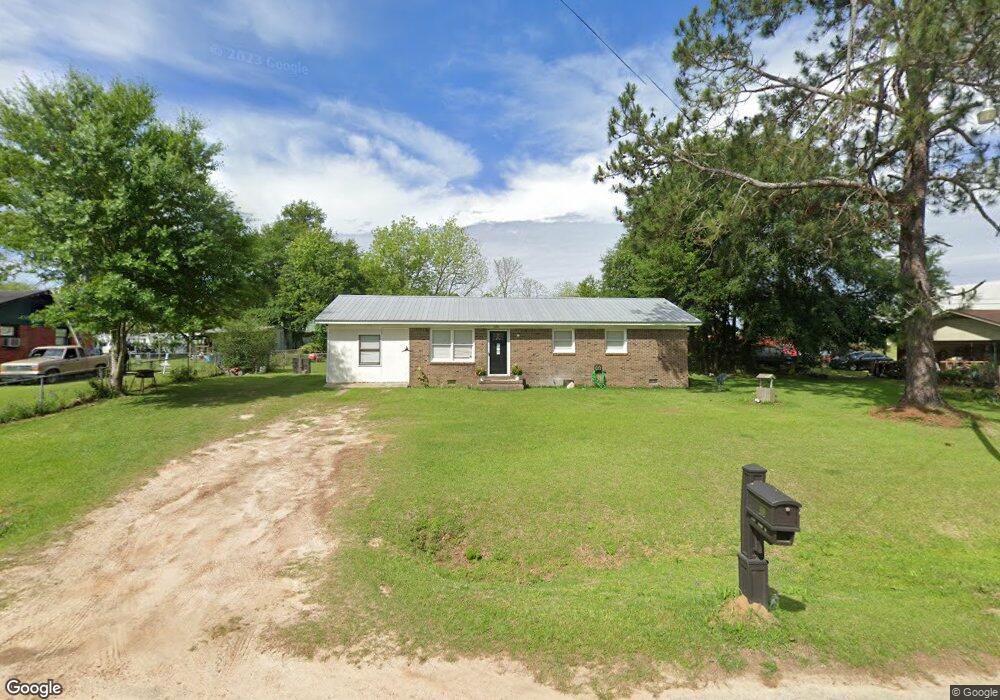
This home is located at 108 Maple St, Omega, GA 31775 and is currently estimated at $121,386, approximately $91 per square foot. 108 Maple St is a home located in Tift County with nearby schools including Omega Elementary School, J.T. Reddick School, and Eighth Street Middle School.
Ownership History
Date
Name
Owned For
Owner Type
Purchase Details
Closed on
Jan 20, 2021
Sold by
Rodriguez Delfino
Bought by
Rojas Rigoberto Garcia and Rojas Monica Garcia
Current Estimated Value
Home Financials for this Owner
Home Financials are based on the most recent Mortgage that was taken out on this home.
Original Mortgage
$90,000
Interest Rate
2.6%
Mortgage Type
New Conventional
Purchase Details
Closed on
Nov 21, 2018
Sold by
R & L Rental Llc
Bought by
Rodriguez Delfino
Purchase Details
Closed on
Jul 27, 1998
Sold by
Ford Consumer Finance Co Inc
Bought by
Henderson Ray
Purchase Details
Closed on
Dec 2, 1997
Sold by
Corey Charles
Bought by
Ford Consumer Financein
Purchase Details
Closed on
Jun 22, 1988
Sold by
Farmers Home Administrat
Bought by
Corey Charles
Create a Home Valuation Report for This Property
The Home Valuation Report is an in-depth analysis detailing your home's value as well as a comparison with similar homes in the area
Home Values in the Area
Average Home Value in this Area
Purchase History
| Date | Buyer | Sale Price | Title Company |
|---|---|---|---|
| Rojas Rigoberto Garcia | $90,000 | -- | |
| Rodriguez Delfino | $40,000 | -- | |
| Henderson Ray | $25,000 | -- | |
| Ford Consumer Financein | $27,900 | -- | |
| Corey Charles | $24,000 | -- |
Source: Public Records
Mortgage History
| Date | Status | Borrower | Loan Amount |
|---|---|---|---|
| Closed | Rojas Rigoberto Garcia | $90,000 |
Source: Public Records
Tax History Compared to Growth
Tax History
| Year | Tax Paid | Tax Assessment Tax Assessment Total Assessment is a certain percentage of the fair market value that is determined by local assessors to be the total taxable value of land and additions on the property. | Land | Improvement |
|---|---|---|---|---|
| 2024 | $930 | $42,612 | $1,360 | $41,252 |
| 2023 | $1,010 | $20,434 | $2,200 | $18,234 |
| 2022 | $607 | $20,434 | $2,200 | $18,234 |
| 2021 | $610 | $20,434 | $2,200 | $18,234 |
| 2020 | $622 | $20,434 | $2,200 | $18,234 |
| 2019 | $486 | $20,434 | $2,200 | $18,234 |
| 2018 | $620 | $20,434 | $2,200 | $18,234 |
| 2017 | $622 | $20,434 | $2,200 | $18,234 |
| 2016 | $623 | $20,434 | $2,200 | $18,234 |
| 2015 | $623 | $20,434 | $2,200 | $18,234 |
| 2014 | $625 | $20,434 | $2,200 | $18,234 |
| 2013 | -- | $20,434 | $2,200 | $18,234 |
Source: Public Records
Map
Nearby Homes
- 122 New St
- 142 Lamar St
- 146 Lamar St
- 1427 S Ty Omega Rd
- 160 Main Street Crosland
- 171 Ellis Bryan Rd
- 1396 Livingston Bridge Rd
- 187 Bussell Rd
- 54 Jacks Way
- 4554 Carpenter Rd S
- 5015 Union Rd
- 4502 Carpenter Rd S
- 0 Deer Run Cir
- 33 Surrey Cir
- 45 Surrey Cir
- 27 Water's Edge Way
- 4716 Union Rd
- 17 Waters Edge Way
- 1802 Golden Rd W
- 4104 London Ln