A
Seller's Agent in 2025
Amanda Forck
South County Realty
9 in this area
26 Total Sales
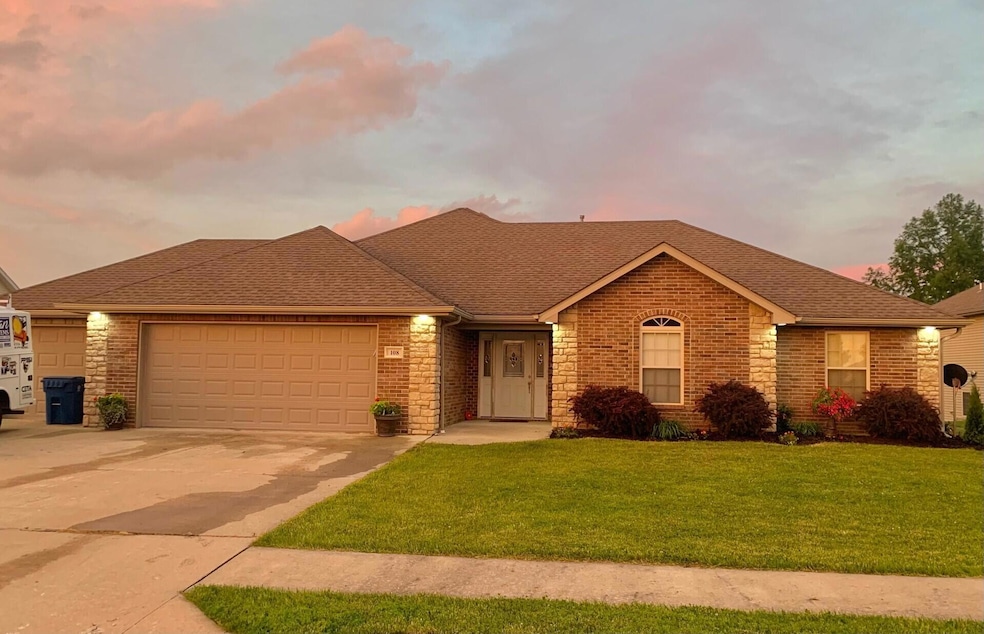
This beautiful home is ready for you to make it your own! With 3 bedrooms, 2 bathrooms and a 3 car garage, it will be sure to please! Brand new carpet placed 10/2025! A gas fireplace in the living room will keep you warm on the cooler nights headed our way. This home features a split bedroom design and a kitchen/dining room layout with lots of space!
Last Agent to Sell the Property
South County Realty License #2020031025 Listed on: 11/03/2025

| Date | Type | Sale Price | Title Company |
|---|---|---|---|
| Warranty Deed | -- | Boone Central Title | |
| Interfamily Deed Transfer | -- | None Available | |
| Warranty Deed | -- | None Available | |
| Warranty Deed | -- | None Available |
| Date | Status | Loan Amount | Loan Type |
|---|---|---|---|
| Open | $192,000 | New Conventional | |
| Previous Owner | $142,857 | New Conventional | |
| Previous Owner | $131,973 | Construction |
| Date | Event | Price | List to Sale | Price per Sq Ft |
|---|---|---|---|---|
| 12/12/2025 12/12/25 | Sold | -- | -- | -- |
| 11/19/2025 11/19/25 | Pending | -- | -- | -- |
| 11/03/2025 11/03/25 | For Sale | $320,000 | -- | $206 / Sq Ft |
| Year | Tax Paid | Tax Assessment Tax Assessment Total Assessment is a certain percentage of the fair market value that is determined by local assessors to be the total taxable value of land and additions on the property. | Land | Improvement |
|---|---|---|---|---|
| 2025 | $2,816 | $39,957 | $4,750 | $35,207 |
| 2024 | $2,472 | $34,903 | $4,750 | $30,153 |
| 2023 | $2,470 | $34,903 | $4,750 | $30,153 |
| 2022 | $2,307 | $32,319 | $4,750 | $27,569 |
| 2021 | $2,302 | $32,319 | $4,750 | $27,569 |
| 2020 | $2,226 | $31,084 | $4,750 | $26,334 |
| 2019 | $2,226 | $31,084 | $4,750 | $26,334 |
| 2018 | $1,969 | $0 | $0 | $0 |
| 2017 | $1,969 | $31,084 | $4,750 | $26,334 |
| 2016 | $1,974 | $31,084 | $4,750 | $26,334 |
| 2015 | $1,952 | $31,084 | $4,750 | $26,334 |
| 2014 | -- | $31,084 | $4,750 | $26,334 |
A
Seller's Agent in 2025
Amanda Forck
South County Realty
9 in this area
26 Total Sales
Buyer's Agent in 2025
Izzy Smith
RE/MAX
(573) 825-4161
95 in this area
179 Total Sales
Source: Columbia Board of REALTORS®
MLS Number: 430658
APN: 24-203-00-02-021-00-01
Disclaimer: Certain information contained herein is derived from information provided by parties other than Homes.com. All information provided is deemed reliable, but is not guaranteed to be accurate and should be independently verified.
![]() IDX information is provided exclusively for personal, non-commercial use, and may not be used for any purpose other than to identify prospective properties consumers may be interested in purchasing. Information is deemed reliable but not guaranteed.
IDX information is provided exclusively for personal, non-commercial use, and may not be used for any purpose other than to identify prospective properties consumers may be interested in purchasing. Information is deemed reliable but not guaranteed.
Ask me questions while you tour the home.