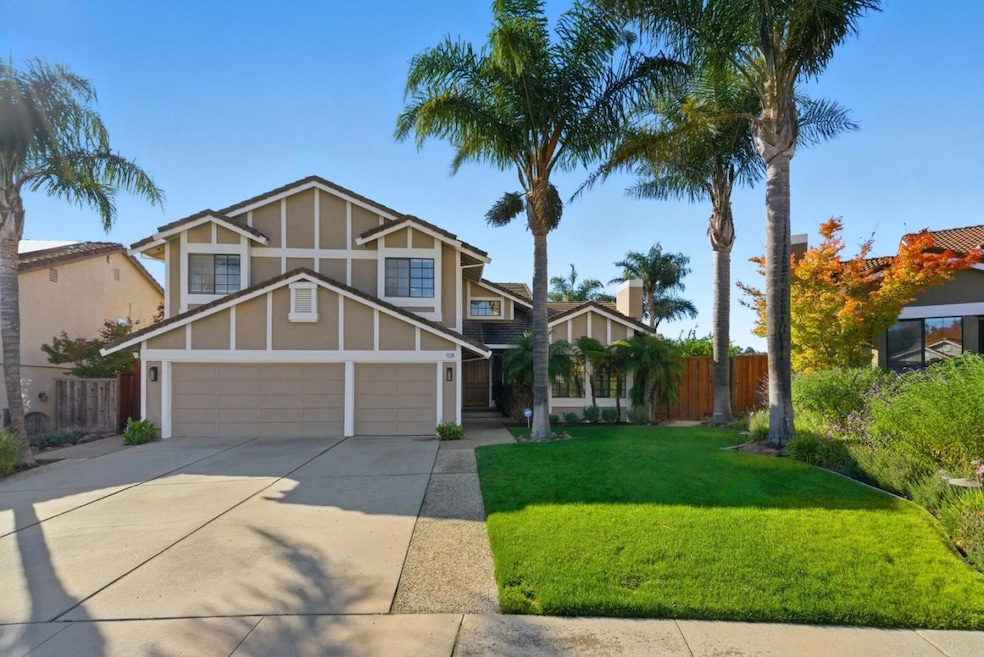
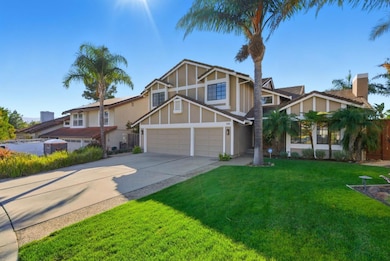
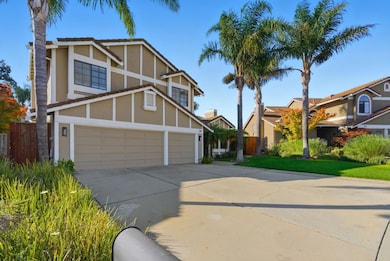
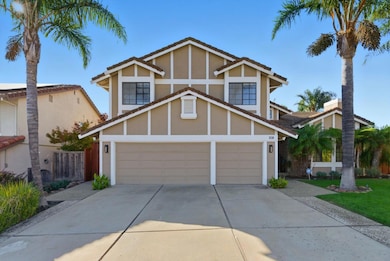

108 Mesa Verde Way San Carlos, CA 94070
Alder Manor NeighborhoodEstimated payment $23,320/month
Highlights
- Above Ground Spa
- Primary Bedroom Suite
- Soaking Tub in Primary Bathroom
- Tierra Linda Middle School Rated A
- Family Room with Fireplace
- Main Floor Bedroom
About This Home
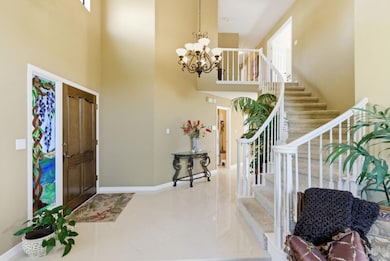
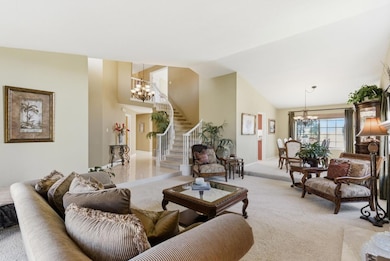
Welcome to 108 Mesa Verde, a meticulously maintained 5-bedroom, 3-bath retreat that blends sophistication with modern comfort. Nestled in one of San Carlos's most sought-after neighborhoods, the home features an exceptional floor plan perfect for entertaining and family living. Formal spaces flow seamlessly into an updated chef's kitchen and expansive great room with sweeping hill views. The private backyard is a resort-like escape with built-in BBQ, hot tub, and multiple areas to relax or dine. Upstairs, generously sized bedrooms offer flexibility, while the primary suite serves as a serene retreat with breathtaking vistas. Additional highlights include a 3-car garage, manicured landscaping, and evident pride of ownership. Located in the vibrant hills of San Carlos, The City of Good Living, you're minutes from Laurel Street, scenic trails, and top-rated schools, including Heather Elementary, Tierra Linda Middle, and Carlmont High. 108 Mesa Verde perfectly balances luxury, function, and California lifestyle, ready to welcome you home.
Home Details
Home Type
- Single Family
Est. Annual Taxes
- $26,486
Year Built
- Built in 1987
Lot Details
- 10,045 Sq Ft Lot
- Wood Fence
- Sprinklers on Timer
- Grass Covered Lot
- Back Yard
- Zoning described as PC0000
Parking
- 3 Car Attached Garage
- Workshop in Garage
- Guest Parking
- On-Street Parking
- Off-Street Parking
Home Design
- Tile Roof
- Concrete Roof
- Concrete Perimeter Foundation
Interior Spaces
- 3,120 Sq Ft Home
- 2-Story Property
- High Ceiling
- Ceiling Fan
- Wood Burning Fireplace
- Double Pane Windows
- Garden Windows
- Formal Entry
- Family Room with Fireplace
- 2 Fireplaces
- Great Room
- Living Room with Fireplace
- Formal Dining Room
- Utility Room
- Alarm System
Kitchen
- Breakfast Area or Nook
- Eat-In Kitchen
- Breakfast Bar
- Built-In Double Oven
- Gas Oven
- Gas Cooktop
- Range Hood
- Microwave
- Ice Maker
- Dishwasher
- Kitchen Island
- Granite Countertops
- Disposal
Flooring
- Carpet
- Tile
- Vinyl
Bedrooms and Bathrooms
- 5 Bedrooms
- Main Floor Bedroom
- Primary Bedroom Suite
- Walk-In Closet
- Bathroom on Main Level
- 3 Full Bathrooms
- Dual Sinks
- Soaking Tub in Primary Bathroom
- Bathtub with Shower
- Oversized Bathtub in Primary Bathroom
- Bathtub Includes Tile Surround
- Walk-in Shower
Laundry
- Laundry Room
- Washer and Dryer
Outdoor Features
- Above Ground Spa
- Balcony
- Outdoor Kitchen
- Barbecue Area
Utilities
- Forced Air Heating and Cooling System
- Vented Exhaust Fan
- Thermostat
- Separate Meters
- Individual Gas Meter
Listing and Financial Details
- Assessor Parcel Number 050-431-130
Map
Home Values in the Area
Average Home Value in this Area
Tax History
| Year | Tax Paid | Tax Assessment Tax Assessment Total Assessment is a certain percentage of the fair market value that is determined by local assessors to be the total taxable value of land and additions on the property. | Land | Improvement |
|---|---|---|---|---|
| 2025 | $26,486 | $2,233,040 | $1,116,520 | $1,116,520 |
| 2023 | $26,486 | $2,146,330 | $1,073,165 | $1,073,165 |
| 2022 | $24,865 | $2,104,246 | $1,052,123 | $1,052,123 |
| 2021 | $24,546 | $2,062,988 | $1,031,494 | $1,031,494 |
| 2020 | $24,310 | $2,041,836 | $1,020,918 | $1,020,918 |
| 2019 | $23,987 | $2,001,800 | $1,000,900 | $1,000,900 |
| 2018 | $23,369 | $1,962,550 | $981,275 | $981,275 |
| 2017 | $23,098 | $1,924,070 | $962,035 | $962,035 |
| 2016 | $22,648 | $1,886,344 | $943,172 | $943,172 |
| 2015 | $22,565 | $1,858,010 | $929,005 | $929,005 |
| 2014 | $22,019 | $1,821,616 | $910,808 | $910,808 |
Property History
| Date | Event | Price | List to Sale | Price per Sq Ft |
|---|---|---|---|---|
| 11/12/2025 11/12/25 | Pending | -- | -- | -- |
| 10/23/2025 10/23/25 | For Sale | $3,998,000 | -- | $1,281 / Sq Ft |
Purchase History
| Date | Type | Sale Price | Title Company |
|---|---|---|---|
| Interfamily Deed Transfer | -- | Old Republic Title Company | |
| Interfamily Deed Transfer | -- | Old Republic Title Company | |
| Interfamily Deed Transfer | -- | None Available | |
| Grant Deed | $1,602,000 | Alliance Title |
Mortgage History
| Date | Status | Loan Amount | Loan Type |
|---|---|---|---|
| Open | $765,000 | New Conventional | |
| Closed | $1,250,000 | Negative Amortization |
Source: MLSListings
MLS Number: ML82025747
APN: 050-431-130
Disclaimer: Certain information contained herein is derived from information provided by parties other than Homes.com. All information provided is deemed reliable, but is not guaranteed to be accurate and should be independently verified.
![]() Property Information © 2025 MLSListings Inc. All rights reserved. Listing information is deemed reliable but not guaranteed. Certain information contained herein is derived from information which is the licensed property of, and copyrighted by, MLSListings Inc. The viewer acknowledges ownership and validity of its copyright. Information provided is for personal, non-commercial use by a viewer with a bona fide interest in the purchase or sale of real estate of the type being offered via this website or other electronic means. The viewer is prohibited from copying, redistributing or retransmitting any of the data or information provided by MLSListing, Inc.
Property Information © 2025 MLSListings Inc. All rights reserved. Listing information is deemed reliable but not guaranteed. Certain information contained herein is derived from information which is the licensed property of, and copyrighted by, MLSListings Inc. The viewer acknowledges ownership and validity of its copyright. Information provided is for personal, non-commercial use by a viewer with a bona fide interest in the purchase or sale of real estate of the type being offered via this website or other electronic means. The viewer is prohibited from copying, redistributing or retransmitting any of the data or information provided by MLSListing, Inc.
- 119 Mesa Verde Way
- 3295 La Mesa Dr Unit 7
- 3322 Brittan Ave Unit 11
- 3350 La Mesa Dr Unit 10
- 3372 La Mesa Dr Unit 2
- 3350 La Mesa Dr Unit 4
- 3374 Brittan Ave Unit 13
- 3104 Brittan Ave
- 5 El Vanada Rd
- 865 Somerset Ct
- 758 Loma
- 416 Palomar Dr
- 438 Portofino Dr Unit 101
- 00 S Palomar Dr
- 0 S Palomar Dr
- 303 Lakeview Way
- 289 Kings Ct
- 401 Winding Way
- 11 Lilly Ln
- 10 Winding Way
