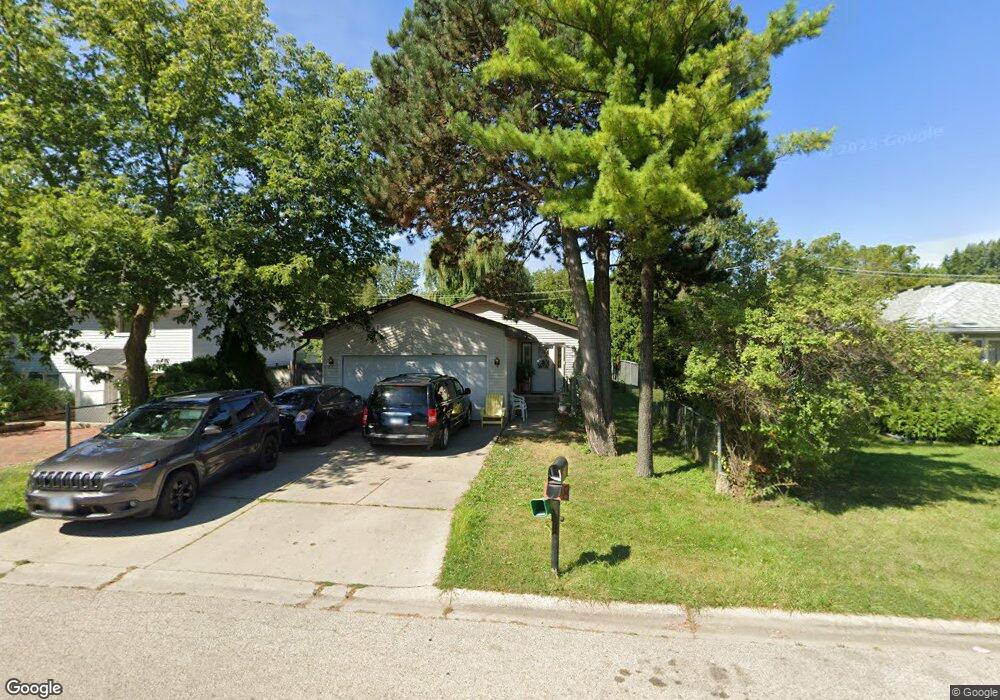
108 N Frolic Ave Waukegan, IL 60085
Washington Hills NeighborhoodEstimated Value: $257,000 - $313,000
3
Beds
2
Baths
1,436
Sq Ft
$199/Sq Ft
Est. Value
About This Home
This home is located at 108 N Frolic Ave, Waukegan, IL 60085 and is currently estimated at $285,855, approximately $199 per square foot. 108 N Frolic Ave is a home located in Lake County with nearby schools including Whittier Elementary School, Robert E. Abbott Middle School, and Waukegan High School.
Ownership History
Date
Name
Owned For
Owner Type
Purchase Details
Closed on
Mar 29, 2007
Sold by
Jarencio Juan V and Jarencio Vizminda A
Bought by
Sanchez Israel and Godinez Maria
Current Estimated Value
Home Financials for this Owner
Home Financials are based on the most recent Mortgage that was taken out on this home.
Original Mortgage
$186,000
Outstanding Balance
$112,769
Interest Rate
6.2%
Mortgage Type
Purchase Money Mortgage
Estimated Equity
$173,086
Purchase Details
Closed on
Dec 10, 2004
Sold by
Melnik Alan and Judy M Parr Declaration Of Tru
Bought by
Jarencio Juan V and Jarencio Vizminda A
Home Financials for this Owner
Home Financials are based on the most recent Mortgage that was taken out on this home.
Original Mortgage
$174,377
Interest Rate
5.82%
Mortgage Type
FHA
Purchase Details
Closed on
Dec 28, 1998
Sold by
Parr William A and Parr Judy M
Bought by
Parr Judy M and Trust #108
Create a Home Valuation Report for This Property
The Home Valuation Report is an in-depth analysis detailing your home's value as well as a comparison with similar homes in the area
Home Values in the Area
Average Home Value in this Area
Purchase History
| Date | Buyer | Sale Price | Title Company |
|---|---|---|---|
| Sanchez Israel | $186,000 | First American Title Ins Co | |
| Jarencio Juan V | $177,500 | First American Title | |
| Parr Judy M | -- | -- |
Source: Public Records
Mortgage History
| Date | Status | Borrower | Loan Amount |
|---|---|---|---|
| Open | Sanchez Israel | $186,000 | |
| Previous Owner | Jarencio Juan V | $174,377 |
Source: Public Records
Tax History Compared to Growth
Tax History
| Year | Tax Paid | Tax Assessment Tax Assessment Total Assessment is a certain percentage of the fair market value that is determined by local assessors to be the total taxable value of land and additions on the property. | Land | Improvement |
|---|---|---|---|---|
| 2024 | $6,472 | $85,593 | $9,786 | $75,807 |
| 2023 | $6,524 | $76,632 | $8,762 | $67,870 |
| 2022 | $6,524 | $72,731 | $8,073 | $64,658 |
| 2021 | $5,861 | $62,215 | $6,896 | $55,319 |
| 2020 | $5,890 | $57,960 | $6,424 | $51,536 |
| 2019 | $5,875 | $53,111 | $5,887 | $47,224 |
| 2018 | $5,233 | $46,857 | $7,575 | $39,282 |
| 2017 | $5,044 | $41,456 | $6,702 | $34,754 |
| 2016 | $4,640 | $36,024 | $5,824 | $30,200 |
| 2015 | $4,433 | $32,242 | $5,213 | $27,029 |
| 2014 | $3,888 | $28,519 | $5,111 | $23,408 |
| 2012 | $5,039 | $30,899 | $5,538 | $25,361 |
Source: Public Records
Map
Nearby Homes
- 102 Baldwin Ave
- 24 Washington Terrace
- 3170 W Monroe St Unit 309
- 0 Brookside Ave
- 621 N Austin Ave
- 34887 N Austin Ave
- 603 N Austin Ave
- 2726 W Hidden Glen Dr
- 525 Lawrence Ave
- 12698 W Grandview Ave
- 12716 W Grandview Ave
- 3482 Ellis Ave
- 615 Tiffany Dr
- 3210 W Grandview Ave
- 12601 W Atlantic Ave
- 2116 & 2101 Williamsburg Dr
- 49 S Lewis Ave
- 3027 Belvidere Rd
- 3503 Elaine Ave
- 1213 Grand Ave
- 112 N Frolic Ave
- 104 N Frolic Ave
- 114 N Frolic Ave
- 102 N Frolic Ave
- 109 N Frolic Ave
- 111 N Frolic Ave
- 107 N Frolic Ave
- 116 N Frolic Ave
- 100 N Frolic Ave
- 113 N Frolic Ave
- 103 N Frolic Ave
- 115 N Frolic Ave
- 101 N Frolic Ave
- 118 N Frolic Ave
- 117 N Frolic Ave
- 3016 W Cornelia Ave
- 2901 W Monroe St
- 120 N Frolic Ave
- 108 Baldwin Ave
- 110 Baldwin Ave