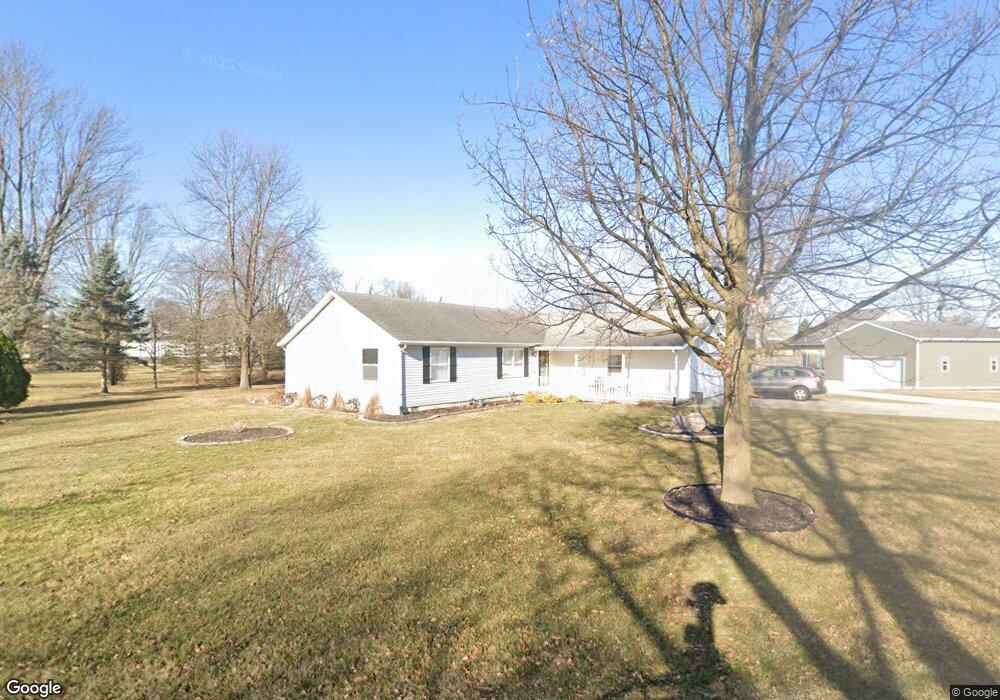
108 N Joslyn St Arcadia, OH 44804
Estimated Value: $173,000 - $246,000
3
Beds
2
Baths
1,768
Sq Ft
$121/Sq Ft
Est. Value
About This Home
This home is located at 108 N Joslyn St, Arcadia, OH 44804 and is currently estimated at $214,168, approximately $121 per square foot. 108 N Joslyn St is a home located in Hancock County with nearby schools including Arcadia Elementary School and Arcadia High School.
Ownership History
Date
Name
Owned For
Owner Type
Purchase Details
Closed on
Dec 2, 2025
Sold by
Lilly Clay and Lilly Kendal
Bought by
Risner Kelly
Current Estimated Value
Home Financials for this Owner
Home Financials are based on the most recent Mortgage that was taken out on this home.
Original Mortgage
$170,000
Outstanding Balance
$169,837
Interest Rate
6.19%
Mortgage Type
New Conventional
Estimated Equity
$44,331
Purchase Details
Closed on
Jun 13, 2022
Sold by
Moses Donald Lee
Bought by
Lilly Clay and Lilly Kendal
Home Financials for this Owner
Home Financials are based on the most recent Mortgage that was taken out on this home.
Original Mortgage
$152,000
Interest Rate
5.1%
Mortgage Type
New Conventional
Purchase Details
Closed on
Mar 11, 2020
Sold by
Moses Donald Lee and Moses Revocable Liv Donald Lee
Bought by
Moses Donald Lee
Home Financials for this Owner
Home Financials are based on the most recent Mortgage that was taken out on this home.
Original Mortgage
$90,000
Interest Rate
3.1%
Mortgage Type
New Conventional
Purchase Details
Closed on
Mar 4, 1994
Bought by
Moses Donald L and Moses Waunita E
Purchase Details
Closed on
Aug 19, 1992
Bought by
Damon Maude E
Create a Home Valuation Report for This Property
The Home Valuation Report is an in-depth analysis detailing your home's value as well as a comparison with similar homes in the area
Purchase History
| Date | Buyer | Sale Price | Title Company |
|---|---|---|---|
| Risner Kelly | $245,000 | Whitman Title | |
| Lilly Clay | $190,000 | None Listed On Document | |
| Moses Donald Lee | -- | Servicelink | |
| Moses Donald L | -- | -- | |
| Damon Maude E | -- | -- |
Source: Public Records
Mortgage History
| Date | Status | Borrower | Loan Amount |
|---|---|---|---|
| Open | Risner Kelly | $170,000 | |
| Previous Owner | Lilly Clay | $152,000 | |
| Previous Owner | Moses Donald Lee | $90,000 |
Source: Public Records
Tax History
| Year | Tax Paid | Tax Assessment Tax Assessment Total Assessment is a certain percentage of the fair market value that is determined by local assessors to be the total taxable value of land and additions on the property. | Land | Improvement |
|---|---|---|---|---|
| 2024 | $2,026 | $59,530 | $3,810 | $55,720 |
| 2023 | $2,042 | $59,530 | $3,810 | $55,720 |
| 2022 | $2,052 | $59,530 | $3,810 | $55,720 |
| 2021 | $1,606 | $53,780 | $3,810 | $49,970 |
| 2020 | $1,598 | $53,780 | $3,810 | $49,970 |
| 2019 | $1,565 | $53,780 | $3,810 | $49,970 |
| 2018 | $1,436 | $49,050 | $3,470 | $45,580 |
| 2017 | $1,462 | $49,050 | $3,470 | $45,580 |
| 2016 | $1,422 | $49,050 | $3,470 | $45,580 |
| 2015 | $1,377 | $46,580 | $2,170 | $44,410 |
| 2014 | $1,390 | $46,580 | $2,170 | $44,410 |
| 2012 | $1,432 | $46,580 | $2,170 | $44,410 |
Source: Public Records
Map
Nearby Homes
- 4090 Township Road 254
- 21356 State Route 12
- 17024 E State Route 12
- 909 Township Road 243
- 5826 Township Road 243
- 5844 Township Road 243
- 18436 E US Route 224
- 0 Olympic Ct
- 0 Treetop Ct
- 0 Waterford Way Unit 6104588
- 7033 Red Hawk Dr
- 7019 Red Hawk Dr
- 15803 County Road 216
- 20711 Ohio 613
- 1302 Dr
- 8500 Township Road 254
- 109 N Harrison St
- 23652 Us Highway 224
- 0 Hickory Ln Unit 1
- 0 Hickory Ln Unit 1 307878
- 203 S Gibson St
- 205 E South St
- 112 N Joslyn St
- 107 N Joslyn St
- 109 N Joslyn St
- 203 E South St
- 103 N Joslyn St
- 301 E South St
- 201 E South St
- 105 S Gibson St
- 101 N Joslyn St
- 204 E Fremont St
- 303 E South St
- 103 S Gibson St
- 102 N Scott St
- 206 E South St
- 100 N Scott St
- 104 N Scott St
- 300 E Fremont St
- 204 E South St
Your Personal Tour Guide
Ask me questions while you tour the home.