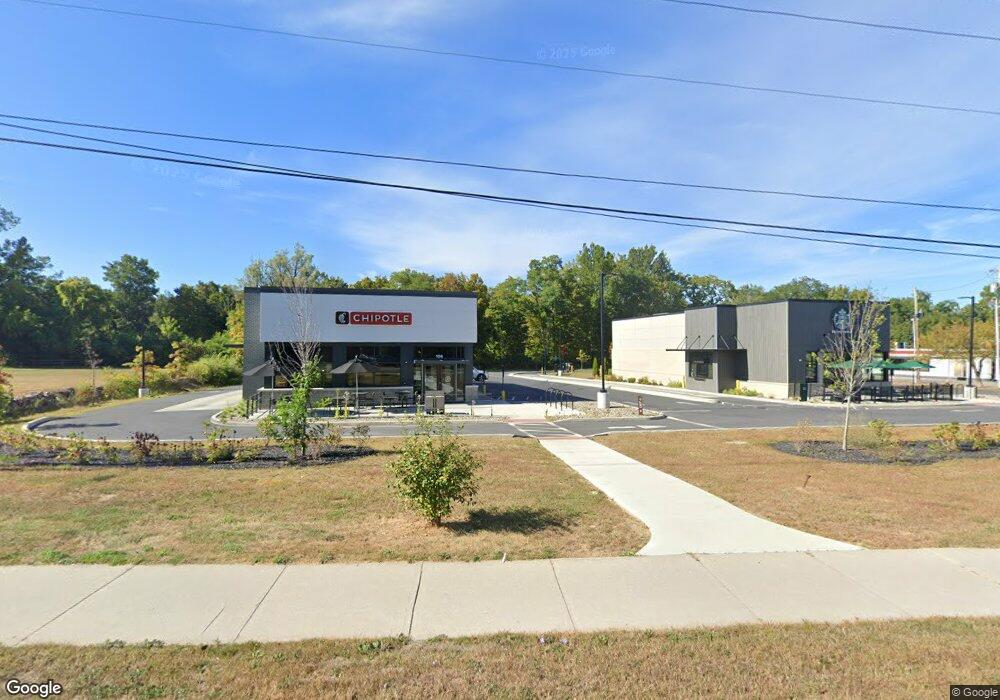
108 Northside Dr Bennington, VT 05201
Estimated Value: $2,691,504
Studio
--
Bath
2,445
Sq Ft
$1,101/Sq Ft
Est. Value
About This Home
This home is located at 108 Northside Dr, Bennington, VT 05201 and is currently estimated at $2,691,504, approximately $1,100 per square foot. 108 Northside Dr is a home located in Bennington County with nearby schools including Bennington Elementary School, Mt. Anthony Union Middle School, and Mt. Anthony Union High School.
Ownership History
Date
Name
Owned For
Owner Type
Purchase Details
Closed on
Jun 5, 2025
Sold by
Bennington Dt1 Llc
Bought by
Northside Bennington Llc
Current Estimated Value
Purchase Details
Closed on
May 9, 2024
Sold by
Bennington Dt 1 Llc
Bought by
Bennington Dt 1 Llc
Purchase Details
Closed on
Dec 28, 2022
Sold by
James F Langway Tte Jfl Bennington Re
Bought by
Bennington Dt 1 Llc
Purchase Details
Closed on
Dec 19, 2014
Sold by
Eds Realty Inc
Bought by
Jfl Bennington Realty Trust and Langway
Create a Home Valuation Report for This Property
The Home Valuation Report is an in-depth analysis detailing your home's value as well as a comparison with similar homes in the area
Home Values in the Area
Average Home Value in this Area
Purchase History
| Date | Buyer | Sale Price | Title Company |
|---|---|---|---|
| Northside Bennington Llc | $2,625,000 | -- | |
| Bennington Dt 1 Llc | -- | -- | |
| Bennington Dt 1 Llc | -- | -- | |
| Bennington Dt 1 Llc | $799,000 | -- | |
| Bennington Dt 1 Llc | $799,000 | -- | |
| Bennington Dt 1 Llc | $799,000 | -- | |
| Jfl Bennington Realty Trust | $610,500 | -- |
Source: Public Records
Tax History
| Year | Tax Paid | Tax Assessment Tax Assessment Total Assessment is a certain percentage of the fair market value that is determined by local assessors to be the total taxable value of land and additions on the property. | Land | Improvement |
|---|---|---|---|---|
| 2024 | $16,844 | $478,800 | $362,500 | $116,300 |
| 2023 | $20,000 | $610,500 | $485,000 | $125,500 |
| 2022 | $15,556 | $610,500 | $485,000 | $125,500 |
| 2021 | $9,975 | $610,500 | $485,000 | $125,500 |
| 2020 | $15,239 | $610,500 | $485,000 | $125,500 |
| 2019 | $14,659 | $610,500 | $485,000 | $125,500 |
| 2018 | $14,394 | $610,500 | $485,000 | $125,500 |
| 2017 | $16,983 | $610,500 | $485,000 | $125,500 |
| 2016 | $14,016 | $610,500 | $485,000 | $125,500 |
| 2015 | -- | $6,105 | $0 | $0 |
| 2014 | -- | $6,105 | $0 | $0 |
| 2013 | -- | $6,105 | $0 | $0 |
Source: Public Records
Map
Nearby Homes
- 301 Northside Dr
- 14 Robinson Ave
- 318 North St
- 130 Lincoln St
- 307 North St
- 415 County St
- 113 Main St
- 328 Chester Knoll Dr
- 318 Chester Knoll Dr
- 720 N Branch St
- 235 Maple St
- 16 West Rd
- 210 Division St
- 136 North St
- 933 East Rd
- 00 Silk Rd
- 93 Russett Dr
- 235 Elm St Unit 3
- 126 Washington Ave
- 239 - 241 Elm St
Your Personal Tour Guide
Ask me questions while you tour the home.