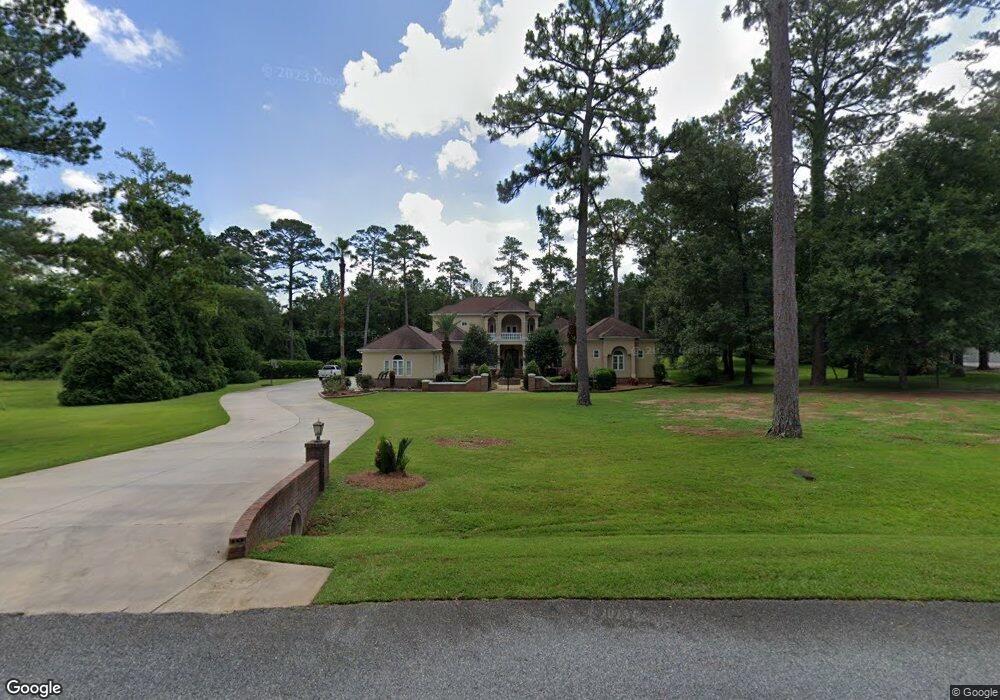
108 Nunnally Way Leesburg, GA 31763
Estimated Value: $1,195,171 - $1,254,000
5
Beds
7
Baths
7,498
Sq Ft
$164/Sq Ft
Est. Value
About This Home
This home is located at 108 Nunnally Way, Leesburg, GA 31763 and is currently estimated at $1,231,724, approximately $164 per square foot. 108 Nunnally Way is a home located in Lee County with nearby schools including Lee County Primary School, Lee County Elementary School, and Lee County Middle School - West Campus.
Ownership History
Date
Name
Owned For
Owner Type
Purchase Details
Closed on
Aug 31, 2016
Sold by
Dixon El and Dixon Roy
Bought by
Jones Brandon
Current Estimated Value
Purchase Details
Closed on
Dec 15, 2006
Sold by
Eyeland Properties Llc
Bought by
Applewhite & Assoicates Inc
Purchase Details
Closed on
Mar 15, 2006
Sold by
Dixon Sheron J
Bought by
Dixon El-Roy
Home Financials for this Owner
Home Financials are based on the most recent Mortgage that was taken out on this home.
Original Mortgage
$150,000
Interest Rate
6.25%
Mortgage Type
New Conventional
Purchase Details
Closed on
Feb 1, 2004
Sold by
Applewhite & Associa
Bought by
Eyeland Properties L
Purchase Details
Closed on
Mar 9, 1996
Bought by
Applewhite & Associa
Create a Home Valuation Report for This Property
The Home Valuation Report is an in-depth analysis detailing your home's value as well as a comparison with similar homes in the area
Home Values in the Area
Average Home Value in this Area
Purchase History
| Date | Buyer | Sale Price | Title Company |
|---|---|---|---|
| Jones Brandon | $758,000 | -- | |
| Applewhite & Assoicates Inc | -- | -- | |
| Dixon El-Roy | $583,848 | -- | |
| Dixon Sheron J | $583,848 | -- | |
| Eyeland Properties L | $52,000 | -- | |
| Applewhite & Associa | $39,500 | -- |
Source: Public Records
Mortgage History
| Date | Status | Borrower | Loan Amount |
|---|---|---|---|
| Previous Owner | Dixon Sheron J | $150,000 |
Source: Public Records
Tax History Compared to Growth
Tax History
| Year | Tax Paid | Tax Assessment Tax Assessment Total Assessment is a certain percentage of the fair market value that is determined by local assessors to be the total taxable value of land and additions on the property. | Land | Improvement |
|---|---|---|---|---|
| 2024 | $12,368 | $411,400 | $26,000 | $385,400 |
| 2023 | $11,537 | $411,400 | $26,000 | $385,400 |
| 2022 | $11,537 | $411,400 | $26,000 | $385,400 |
| 2021 | $11,614 | $411,400 | $26,000 | $385,400 |
| 2020 | $8,505 | $252,440 | $16,160 | $236,280 |
| 2019 | $8,440 | $252,440 | $16,160 | $236,280 |
| 2018 | $0 | $252,440 | $16,160 | $236,280 |
| 2017 | $7,994 | $252,440 | $16,160 | $236,280 |
| 2016 | $8,057 | $252,440 | $16,160 | $236,280 |
| 2015 | $8,101 | $252,440 | $16,160 | $236,280 |
| 2014 | $8,130 | $252,440 | $16,160 | $236,280 |
| 2013 | -- | $252,440 | $16,160 | $236,280 |
Source: Public Records
Map
Nearby Homes
- 186 Glen Arven Dr
- Lot 413 Willow Lake Dr
- Lot 414 Willow Lake Dr
- 154 Hank Dr
- 195 Willow Lake Dr
- 227 Longleaf Dr
- 235 Winnstead Dr
- 174 Hank Dr
- 317 Willow Lake Dr
- 151 Hearthstone Dr
- 102 Fair Oaks Ct
- 252 Wiregrass Way
- 176 Fairethorne Dr
- 123 Larkspur Dr
- 137 Joiner Dr
- 7 Joiner Dr
- 8 Joiner Dr
- 9 Joiner Dr
- 232 Tupelo Dr
- LOT 13 Make Ct
- 102 Nunnally Way
- 112 Nunnally Way
- 50 Nunnally Way Unit LOT 50
- 205 Hickory Grove Rd
- 136 Winship Dr
- 197 Hickory Grove Rd
- 213 Hickory Grove Rd
- 191 Hickory Grove Rd
- 118 Nunnally Way
- 219 Hickory Grove Rd
- 125 Winship Dr
- 227 Hickory Grove Rd
- 111 Winship Dr
- 29 Winship Dr
- 179 Hickory Grove Rd
- 164 Glen Arven Dr
- 170 Glen Arven Dr
- 160 Glen Arven Dr
- 174 Glen Arven Dr
- 126 Nunnally Way