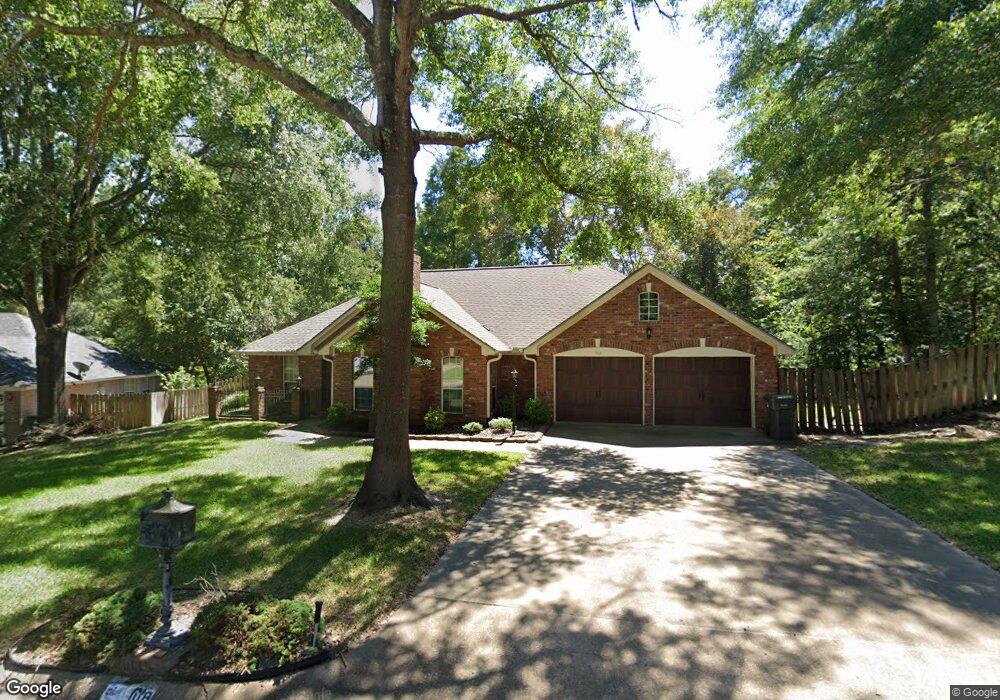
108 Paint Brush Cir Lufkin, TX 75904
Estimated Value: $299,000 - $427,000
--
Bed
10
Baths
2,035
Sq Ft
$166/Sq Ft
Est. Value
About This Home
This home is located at 108 Paint Brush Cir, Lufkin, TX 75904 and is currently estimated at $338,118, approximately $166 per square foot. 108 Paint Brush Cir is a home located in Angelina County with nearby schools including Trout Primary School, Brookhollow Elementary School, and Lufkin Middle School.
Ownership History
Date
Name
Owned For
Owner Type
Purchase Details
Closed on
Apr 19, 2023
Sold by
Bostic Mary W
Bought by
Roche Derek
Current Estimated Value
Home Financials for this Owner
Home Financials are based on the most recent Mortgage that was taken out on this home.
Original Mortgage
$280,250
Outstanding Balance
$272,645
Interest Rate
6.73%
Mortgage Type
Construction
Estimated Equity
$65,473
Purchase Details
Closed on
May 10, 2019
Sold by
Smith Mark D and Smith Pollianne P
Bought by
Bostic Mary W
Home Financials for this Owner
Home Financials are based on the most recent Mortgage that was taken out on this home.
Original Mortgage
$190,215
Interest Rate
4%
Mortgage Type
Commercial
Purchase Details
Closed on
Jul 14, 2008
Sold by
Hickman Donald L and Hickman Tracy
Bought by
Smith Mark D and Smith Mark
Home Financials for this Owner
Home Financials are based on the most recent Mortgage that was taken out on this home.
Original Mortgage
$173,128
Interest Rate
6.11%
Mortgage Type
FHA
Create a Home Valuation Report for This Property
The Home Valuation Report is an in-depth analysis detailing your home's value as well as a comparison with similar homes in the area
Home Values in the Area
Average Home Value in this Area
Purchase History
| Date | Buyer | Sale Price | Title Company |
|---|---|---|---|
| Roche Derek | -- | None Listed On Document | |
| Bostic Mary W | -- | Security & Guaranty Abstract | |
| Smith Mark D | $173,128 | Community Title |
Source: Public Records
Mortgage History
| Date | Status | Borrower | Loan Amount |
|---|---|---|---|
| Open | Roche Derek | $280,250 | |
| Previous Owner | Bostic Mary W | $190,215 | |
| Previous Owner | Smith Mark D | $173,128 |
Source: Public Records
Tax History Compared to Growth
Tax History
| Year | Tax Paid | Tax Assessment Tax Assessment Total Assessment is a certain percentage of the fair market value that is determined by local assessors to be the total taxable value of land and additions on the property. | Land | Improvement |
|---|---|---|---|---|
| 2025 | $6,782 | $324,510 | $33,060 | $291,450 |
| 2024 | $6,702 | $320,700 | $33,060 | $287,640 |
| 2023 | $6,342 | $319,160 | $33,060 | $286,100 |
| 2022 | $5,719 | $251,110 | $33,060 | $218,050 |
| 2021 | $5,777 | $234,520 | $33,060 | $201,460 |
| 2020 | $5,054 | $205,670 | $33,060 | $172,610 |
| 2019 | $5,346 | $205,670 | $33,060 | $172,610 |
| 2018 | $4,263 | $203,980 | $33,060 | $170,920 |
| 2017 | $4,263 | $191,550 | $27,550 | $164,000 |
| 2016 | $4,495 | $188,570 | $27,550 | $161,020 |
| 2015 | $4,305 | $188,570 | $27,550 | $161,020 |
| 2014 | $4,305 | $185,720 | $27,550 | $158,170 |
Source: Public Records
Map
Nearby Homes
- 308 Paintbrush Cir
- 1409 Bending Brook Cir
- 1706 Juniper Ln
- 1503 Blue Bonnet St
- 1504 Azalea Dr
- 1904 Loblolly Ln
- 1514 Spanish Moss Dr
- 1442 Sleepy Hollow Dr
- 1442 Sleepy Hollow Dr
- 350 Quail Creek Dr
- 1308 Live Oak Ln
- 1308 Walnut Bend Dr
- Lot 2 Shady Elm
- Lot 1 Shady Elm
- 1308 Brook Hollow Dr
- 1304 Walnut Bend Dr
- 1400 Brookwood Place
- 1204 Live Oak Ln
- TBD Bending Oak St
- 107 Bending Oak St
- 108 Paintbrush Cir
- 106 Paint Brush Cir
- 106 Paintbrush Cir
- 110 Paint Brush Cir
- 1905 Columbine Dr
- 208 Paintbrush Cir
- 205 Paint Brush Cir
- 202 Paintbrush Cir
- 202 Paintbrush Cir
- 202 Paint Brush Cir
- 407 Paint Brush Cir
- 407 Paintbrush Cir
- 204 Paintbrush Cir
- 204 Paint Brush Cir
- 405 Paintbrush Cir
- 405 Paint Brush Cir
- 206 Paint Brush Cir
- 207 Paint Brush Cir
- 206 Paintbrush Cir
- 1904 Columbine