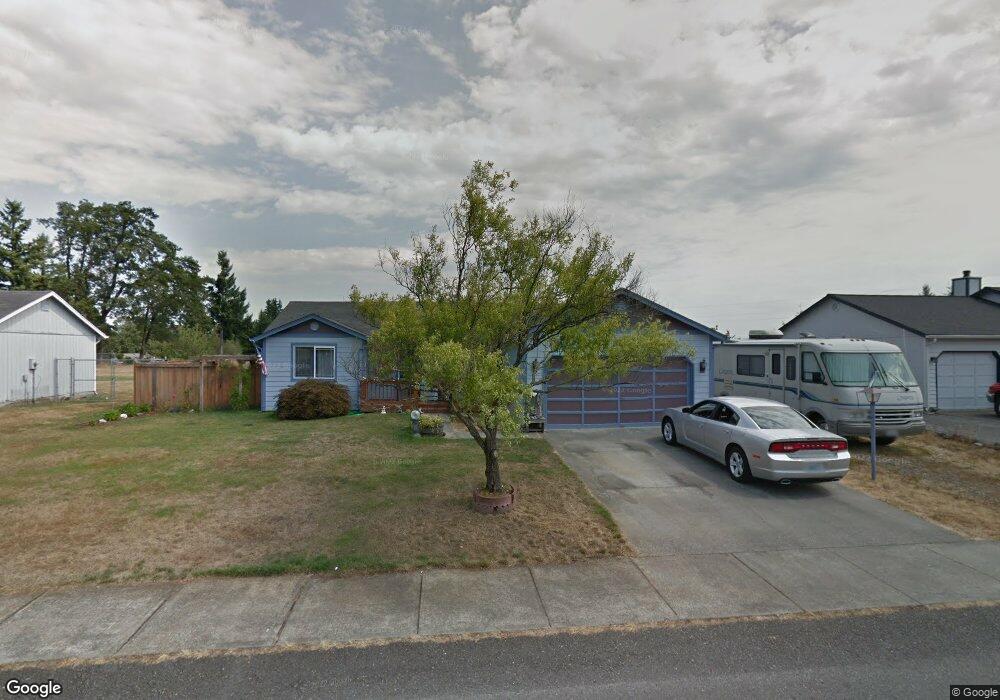
108 Rainier Estates Ct SE Rainier, WA 98576
Estimated Value: $442,000 - $470,308
3
Beds
2
Baths
1,278
Sq Ft
$354/Sq Ft
Est. Value
About This Home
This home is located at 108 Rainier Estates Ct SE, Rainier, WA 98576 and is currently estimated at $452,327, approximately $353 per square foot. 108 Rainier Estates Ct SE is a home located in Thurston County with nearby schools including Rainier Elementary School, Rainier Middle School, and Rainier Senior High School.
Ownership History
Date
Name
Owned For
Owner Type
Purchase Details
Closed on
Nov 15, 2005
Sold by
Kaattari Diana
Bought by
Morris Clay A and Morris Diana M
Current Estimated Value
Home Financials for this Owner
Home Financials are based on the most recent Mortgage that was taken out on this home.
Original Mortgage
$180,000
Outstanding Balance
$119,365
Interest Rate
9.74%
Mortgage Type
Balloon
Estimated Equity
$332,962
Purchase Details
Closed on
Jul 23, 2004
Sold by
Fennell John A and Fennell Ann G
Bought by
Kaattari Diana
Home Financials for this Owner
Home Financials are based on the most recent Mortgage that was taken out on this home.
Original Mortgage
$127,920
Interest Rate
7.75%
Mortgage Type
Unknown
Purchase Details
Closed on
Jan 16, 1996
Sold by
Rainier General Development Inc
Bought by
Fennell John A and Fennell Ann G
Home Financials for this Owner
Home Financials are based on the most recent Mortgage that was taken out on this home.
Original Mortgage
$113,118
Interest Rate
7.18%
Mortgage Type
VA
Create a Home Valuation Report for This Property
The Home Valuation Report is an in-depth analysis detailing your home's value as well as a comparison with similar homes in the area
Home Values in the Area
Average Home Value in this Area
Purchase History
| Date | Buyer | Sale Price | Title Company |
|---|---|---|---|
| Morris Clay A | -- | First American Title | |
| Kaattari Diana | $159,900 | Transnation Title | |
| Fennell John A | $110,900 | Transamerica Title Insurance |
Source: Public Records
Mortgage History
| Date | Status | Borrower | Loan Amount |
|---|---|---|---|
| Open | Morris Clay A | $180,000 | |
| Previous Owner | Kaattari Diana | $127,920 | |
| Previous Owner | Fennell John A | $113,118 | |
| Closed | Kaattari Diana | $31,980 |
Source: Public Records
Tax History Compared to Growth
Tax History
| Year | Tax Paid | Tax Assessment Tax Assessment Total Assessment is a certain percentage of the fair market value that is determined by local assessors to be the total taxable value of land and additions on the property. | Land | Improvement |
|---|---|---|---|---|
| 2024 | $3,776 | $428,200 | $136,800 | $291,400 |
| 2023 | $3,776 | $403,100 | $126,000 | $277,100 |
| 2022 | $3,494 | $399,100 | $102,700 | $296,400 |
| 2021 | $3,021 | $339,000 | $92,500 | $246,500 |
| 2020 | $2,471 | $288,400 | $75,500 | $212,900 |
| 2019 | $2,245 | $213,700 | $65,700 | $148,000 |
| 2018 | $2,400 | $189,900 | $56,800 | $133,100 |
| 2017 | $2,221 | $182,200 | $52,000 | $130,200 |
| 2016 | $2,256 | $175,150 | $59,450 | $115,700 |
| 2014 | -- | $170,550 | $59,450 | $111,100 |
Source: Public Records
Map
Nearby Homes
- 604 Nieland Loop SE
- 987 Tipsoo Loop N
- 509 Rochester St W
- 410 Volesky Dr SE
- 108 2nd St SE
- 108 Centre St S
- 201 Montana Ave
- 308 Easy St SE
- 955 Tipsoo Loop N
- 708 3rd St W
- 701 Myers St SE
- 212 Country Estates Dr W
- 12435 Rainier Acres Rd SE
- 806 Cody St SE
- 932 Tipsoo Loop N
- 101 Meadow Rd SE
- 930 Tipsoo Loop N
- 823 Tipsoo Loop S
- 9944 138th Ave SE
- 11510 Snowcap Ln SE
- 106 Rainier Estates Ct SE
- 110 Rainier Estates Ct SE
- 105 Rainier Estates Ct SE
- 112 Rainier Estates Ct SE
- 107 Rainier Estates Ct SE
- 109 Rainier Estates Ct SE
- 103 Rainier Estates Ct SE
- 202 133rd Ave SE
- 111 Rainier Estates Ct SE
- 109 Raintree Loop SE
- 101 Rainier Estates Ct SE
- 200 133rd Ave SE
- 113 Rainier Estates Ct SE
- 107 Raintree Loop SE
- 206 133rd Ave SE
- 111 Raintree Loop SE
- 113 Raintree Loop SE
- 101 Carver Walk SE
- 115 Rainier Estates Ct SE