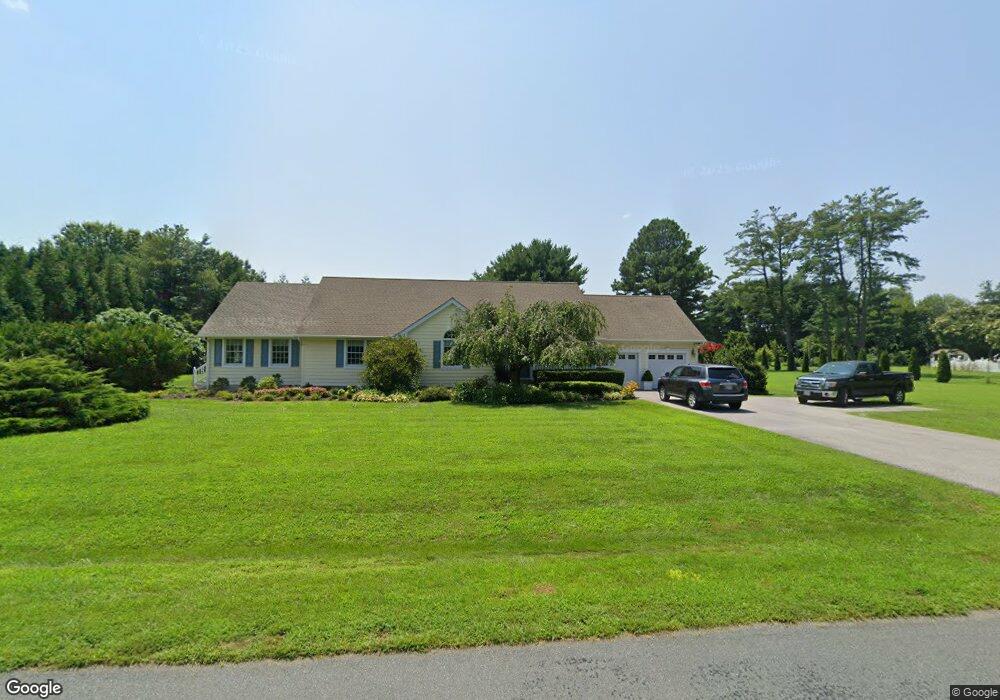
108 River Run Queenstown, MD 21658
Estimated Value: $756,058 - $1,214,000
--
Bed
2
Baths
3,388
Sq Ft
$275/Sq Ft
Est. Value
About This Home
This home is located at 108 River Run, Queenstown, MD 21658 and is currently estimated at $931,515, approximately $274 per square foot. 108 River Run is a home located in Queen Anne's County with nearby schools including Grasonville Elementary School, Stevensville Middle School, and Kent Island High School.
Ownership History
Date
Name
Owned For
Owner Type
Purchase Details
Closed on
Feb 14, 1990
Sold by
Terry Coleman A and Terry Wanda L
Bought by
Rossbach Michael P and Rossbach Lori L
Current Estimated Value
Home Financials for this Owner
Home Financials are based on the most recent Mortgage that was taken out on this home.
Original Mortgage
$152,100
Interest Rate
10.21%
Purchase Details
Closed on
Mar 7, 1988
Sold by
Sommer Randolph L and Sommer Valerie J
Bought by
Terry Coleman A and Terry Wanda L
Home Financials for this Owner
Home Financials are based on the most recent Mortgage that was taken out on this home.
Original Mortgage
$150,000
Interest Rate
9.85%
Purchase Details
Closed on
May 1, 1987
Sold by
Preston Steven A and Preston Irmgard
Bought by
Sommer Randolph L and Sommer Valerie J
Home Financials for this Owner
Home Financials are based on the most recent Mortgage that was taken out on this home.
Original Mortgage
$25,000
Interest Rate
10.47%
Create a Home Valuation Report for This Property
The Home Valuation Report is an in-depth analysis detailing your home's value as well as a comparison with similar homes in the area
Home Values in the Area
Average Home Value in this Area
Purchase History
| Date | Buyer | Sale Price | Title Company |
|---|---|---|---|
| Rossbach Michael P | $169,000 | -- | |
| Terry Coleman A | $50,000 | -- | |
| Sommer Randolph L | $40,000 | -- |
Source: Public Records
Mortgage History
| Date | Status | Borrower | Loan Amount |
|---|---|---|---|
| Closed | Rossbach Michael P | $152,100 | |
| Previous Owner | Terry Coleman A | $150,000 | |
| Previous Owner | Sommer Randolph L | $25,000 |
Source: Public Records
Tax History Compared to Growth
Tax History
| Year | Tax Paid | Tax Assessment Tax Assessment Total Assessment is a certain percentage of the fair market value that is determined by local assessors to be the total taxable value of land and additions on the property. | Land | Improvement |
|---|---|---|---|---|
| 2025 | $4,447 | $493,933 | $0 | $0 |
| 2024 | $4,214 | $441,000 | $186,100 | $254,900 |
| 2023 | $4,131 | $432,200 | $0 | $0 |
| 2022 | $4,048 | $423,400 | $0 | $0 |
| 2021 | $4,036 | $414,600 | $156,100 | $258,500 |
| 2020 | $4,036 | $414,600 | $156,100 | $258,500 |
| 2019 | $4,036 | $414,600 | $156,100 | $258,500 |
| 2018 | $4,094 | $426,800 | $146,100 | $280,700 |
| 2017 | $3,900 | $405,400 | $0 | $0 |
| 2016 | -- | $384,000 | $0 | $0 |
| 2015 | $1,659 | $362,600 | $0 | $0 |
| 2014 | $1,659 | $362,600 | $0 | $0 |
Source: Public Records
Map
Nearby Homes
- 144 River Run
- 0 Grasonville Cemetery Rd
- 915 Sportsman Neck Rd
- 149 Sawmill Ln
- 155 Sawmill Ln
- 149,141,155 Sawmill Ln
- 113 Aslan Ct
- 1326 Perrys Corner Rd
- 201 Sawmill Ln
- 149 Unit 141155 SAWMILL Lane
- The Chester Plan at Whitetail Crossing
- The Cordova Plan at Whitetail Crossing
- The Miles Plan at Whitetail Crossing
- The Caroline Plan at Whitetail Crossing
- 141 Sawmill Ln
- 317 Caspian Dr
- 213 Slippery Hill Ln
- 115 Masters Way
- 29 Fairway Island
- 5128 Main St