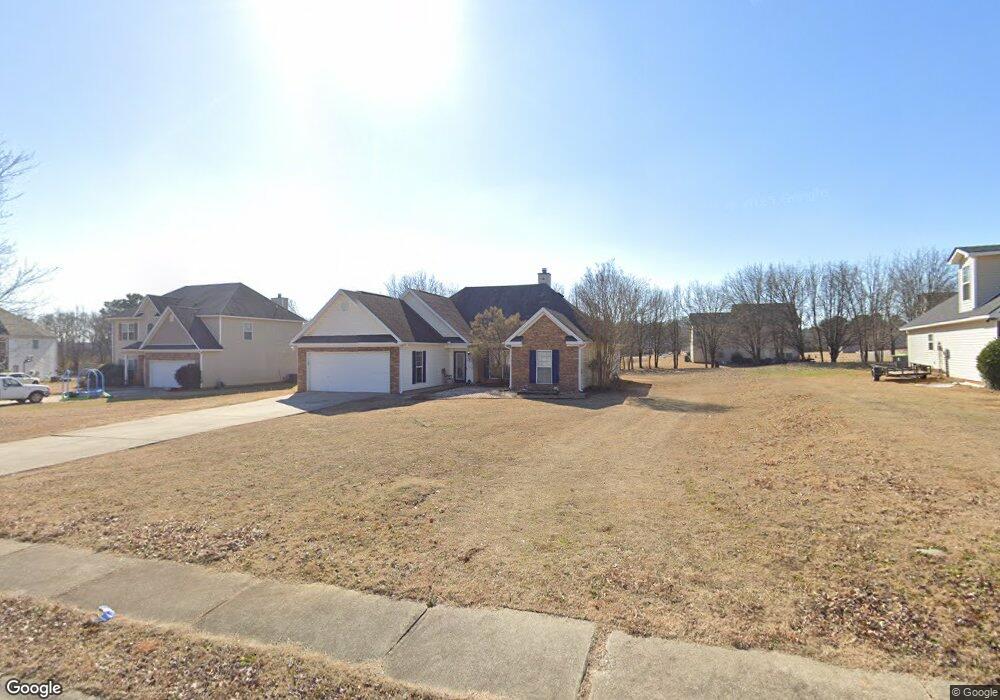
108 Ruby Way Griffin, GA 30224
Spalding County NeighborhoodEstimated Value: $274,952 - $297,000
4
Beds
2
Baths
1,883
Sq Ft
$152/Sq Ft
Est. Value
About This Home
This home is located at 108 Ruby Way, Griffin, GA 30224 and is currently estimated at $285,988, approximately $151 per square foot. 108 Ruby Way is a home located in Spalding County with nearby schools including Moreland Road Elementary School, Carver Road Middle School, and Griffin High School.
Ownership History
Date
Name
Owned For
Owner Type
Purchase Details
Closed on
Dec 21, 2018
Sold by
Dees Chad H
Bought by
Chapman Demarcus A
Current Estimated Value
Home Financials for this Owner
Home Financials are based on the most recent Mortgage that was taken out on this home.
Original Mortgage
$151,515
Outstanding Balance
$132,702
Interest Rate
4.8%
Mortgage Type
New Conventional
Estimated Equity
$153,286
Purchase Details
Closed on
May 11, 2016
Sold by
Dees Chad H
Bought by
Dees Chad H and Moreland Karen L
Home Financials for this Owner
Home Financials are based on the most recent Mortgage that was taken out on this home.
Original Mortgage
$122,735
Interest Rate
3.25%
Mortgage Type
FHA
Purchase Details
Closed on
Jun 26, 2010
Sold by
Brown Keith M and Brown Teresa F
Bought by
Mehta Pravin and Shah Panna
Purchase Details
Closed on
Jul 28, 2006
Sold by
Davis Co Fine Hm Bldg Inc
Bought by
Brown Keith M and Brown Teresa F
Home Financials for this Owner
Home Financials are based on the most recent Mortgage that was taken out on this home.
Original Mortgage
$100,000
Interest Rate
6.6%
Mortgage Type
New Conventional
Create a Home Valuation Report for This Property
The Home Valuation Report is an in-depth analysis detailing your home's value as well as a comparison with similar homes in the area
Home Values in the Area
Average Home Value in this Area
Purchase History
| Date | Buyer | Sale Price | Title Company |
|---|---|---|---|
| Chapman Demarcus A | $150,000 | -- | |
| Dees Chad H | -- | -- | |
| Dees Chad H | $125,000 | -- | |
| Mehta Pravin | $130,000 | -- | |
| Brown Keith M | $150,000 | -- |
Source: Public Records
Mortgage History
| Date | Status | Borrower | Loan Amount |
|---|---|---|---|
| Open | Chapman Demarcus A | $151,515 | |
| Previous Owner | Dees Chad H | $122,735 | |
| Previous Owner | Brown Keith M | $100,000 |
Source: Public Records
Tax History
| Year | Tax Paid | Tax Assessment Tax Assessment Total Assessment is a certain percentage of the fair market value that is determined by local assessors to be the total taxable value of land and additions on the property. | Land | Improvement |
|---|---|---|---|---|
| 2025 | $3,892 | $108,790 | $12,000 | $96,790 |
| 2024 | $3,849 | $108,790 | $12,000 | $96,790 |
| 2023 | $3,964 | $108,790 | $12,000 | $96,790 |
| 2022 | $3,317 | $89,220 | $10,400 | $78,820 |
| 2021 | $2,656 | $71,057 | $10,400 | $60,657 |
| 2020 | $2,227 | $59,052 | $10,400 | $48,652 |
| 2019 | $2,270 | $59,052 | $10,400 | $48,652 |
| 2018 | $2,144 | $54,201 | $10,400 | $43,801 |
| 2017 | $1,931 | $52,324 | $10,400 | $41,924 |
| 2016 | $1,835 | $52,324 | $10,400 | $41,924 |
| 2015 | $1,768 | $49,195 | $10,400 | $38,795 |
| 2014 | $1,796 | $49,195 | $10,400 | $38,795 |
Source: Public Records
Map
Nearby Homes
- 105 Ruby Way
- 103 Quarry Cir
- 131 Bramble Way
- 105 Garnet Ln
- 122 Bramble Way
- 118 Rockbridge Loop
- 2168 Carver Rd
- 103 Huntington Terrace
- 221 Hidden Falls Walk
- 15040 Highway 19
- 15040 U S Highway 19
- 15046 U S 19
- 14375 U S 19
- 15390 U S Highway 19 Hwy
- 128 Deer Lake Dr
- 551 Carter Rd
- 234 Lake Chase Dr N
- 211 Lake Chase Dr N
- 17 Brookwood Way
- 211 Clark Rd
- 110 Ruby Way
- 106 Ruby Way
- 110 Stonebriar Blvd
- 108 Stonebriar Blvd
- 104 Ruby Way
- 112 Stonebriar Blvd
- 112 Stonebriar Blvd Unit 54
- 112 Ruby Way
- 109 Ruby Way
- 107 Ruby Way
- 114 Stonebriar Blvd
- 114 Stonebriar Blvd Unit 53
- 111 Ruby Way
- 114 Ruby Way
- 102 Ruby Way
- 104 Stonebriar Blvd
- 104 Stonebriar Blvd
- 103 Ruby Way
- 113 Ruby Way
- 102 Stonebriar Blvd
Your Personal Tour Guide
Ask me questions while you tour the home.