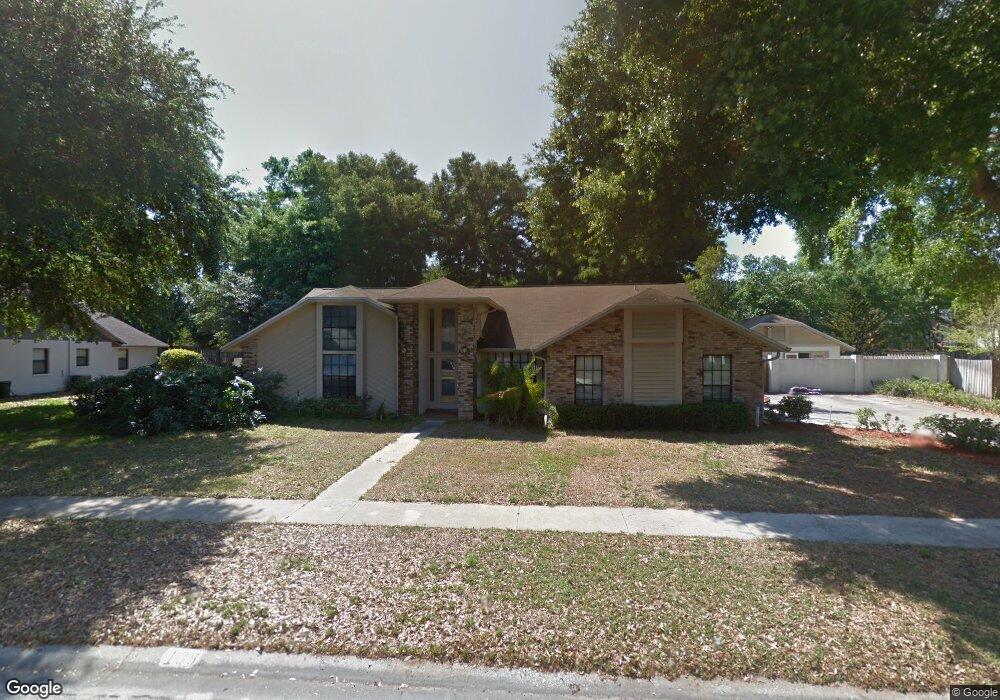
108 Running Horse Rd Seffner, FL 33584
Estimated Value: $490,000 - $552,000
3
Beds
2
Baths
2,259
Sq Ft
$226/Sq Ft
Est. Value
About This Home
This home is located at 108 Running Horse Rd, Seffner, FL 33584 and is currently estimated at $510,649, approximately $226 per square foot. 108 Running Horse Rd is a home located in Hillsborough County with nearby schools including Lopez Elementary School, Burnett Middle School, and Strawberry Crest High School.
Ownership History
Date
Name
Owned For
Owner Type
Purchase Details
Closed on
Aug 29, 2007
Sold by
Godshall Tyler
Bought by
Langley Charles and Langley Katrin
Current Estimated Value
Home Financials for this Owner
Home Financials are based on the most recent Mortgage that was taken out on this home.
Original Mortgage
$310,000
Outstanding Balance
$197,575
Interest Rate
6.7%
Mortgage Type
Unknown
Estimated Equity
$313,074
Purchase Details
Closed on
Dec 19, 2005
Sold by
Rinaldi Victor L
Bought by
Godshall Tyler
Purchase Details
Closed on
Mar 12, 2001
Sold by
Godshall Tyler
Bought by
Godshall Tyler
Purchase Details
Closed on
Nov 14, 2000
Sold by
Melrose Douglas
Bought by
Godshall Tyler and Rinaldi Victor L
Home Financials for this Owner
Home Financials are based on the most recent Mortgage that was taken out on this home.
Original Mortgage
$100,000
Interest Rate
7.93%
Mortgage Type
New Conventional
Create a Home Valuation Report for This Property
The Home Valuation Report is an in-depth analysis detailing your home's value as well as a comparison with similar homes in the area
Home Values in the Area
Average Home Value in this Area
Purchase History
| Date | Buyer | Sale Price | Title Company |
|---|---|---|---|
| Langley Charles | $310,000 | Members Title Agency Llc | |
| Godshall Tyler | $63,000 | None Available | |
| Godshall Tyler | -- | -- | |
| Godshall Tyler | $179,900 | -- |
Source: Public Records
Mortgage History
| Date | Status | Borrower | Loan Amount |
|---|---|---|---|
| Open | Langley Charles | $310,000 | |
| Previous Owner | Godshall Tyler | $92,000 | |
| Previous Owner | Godshall Tyler | $100,000 |
Source: Public Records
Tax History Compared to Growth
Tax History
| Year | Tax Paid | Tax Assessment Tax Assessment Total Assessment is a certain percentage of the fair market value that is determined by local assessors to be the total taxable value of land and additions on the property. | Land | Improvement |
|---|---|---|---|---|
| 2024 | $3,340 | $190,325 | -- | -- |
| 2023 | $3,327 | $184,782 | $0 | $0 |
| 2022 | $3,144 | $179,400 | $0 | $0 |
| 2021 | $3,093 | $174,175 | $0 | $0 |
| 2020 | $2,906 | $171,770 | $0 | $0 |
| 2019 | $2,784 | $167,908 | $0 | $0 |
| 2018 | $2,694 | $164,777 | $0 | $0 |
| 2017 | $2,632 | $225,719 | $0 | $0 |
| 2016 | $2,614 | $158,069 | $0 | $0 |
| 2015 | $2,675 | $156,970 | $0 | $0 |
| 2014 | $2,617 | $155,724 | $0 | $0 |
| 2013 | -- | $153,423 | $0 | $0 |
Source: Public Records
Map
Nearby Homes
- 107 Halton Cir
- 502 Sportsman Park Dr
- 306 Red Elm Place
- 613 Sportsman Park Dr
- 311 Golden Elm Dr
- 104 Apache Ln
- 102 Cash Dr
- 801 Chess Place
- 506 Gay Rd
- 501 Chastain Rd
- 709 Sportsman Park Dr
- 712 Sportsman Park Dr
- 605 de Resine Carre St Unit 605DR
- 510 Tighe Ave
- 102 Alafara St
- 904 Check Place
- 1019 Lakeside Dr
- 807 Old Darby St
- 108 Hillside Dr
- 503 de Resine Carre St Unit 503DR
- 110 Running Horse Rd
- 106 Running Horse Rd
- 312 Halton Cir
- 310 Halton Cir
- 109 Running Horse Rd
- 107 Running Horse Rd
- 314 Halton Cir
- 112 Running Horse Rd
- 111 Running Horse Rd
- 308 Halton Cir
- 105 Running Horse Rd
- 104 Running Horse Rd
- 316 Halton Cir
- 103 Running Horse Rd
- 311 Halton Cir
- 306 Halton Cir
- 202 Running Horse Rd
- 201 Running Horse Rd
- 309 Halton Cir
- 101 Running Horse Rd