Estimated Value: $148,000 - $191,000
--
Bed
2
Baths
1,247
Sq Ft
$132/Sq Ft
Est. Value
About This Home
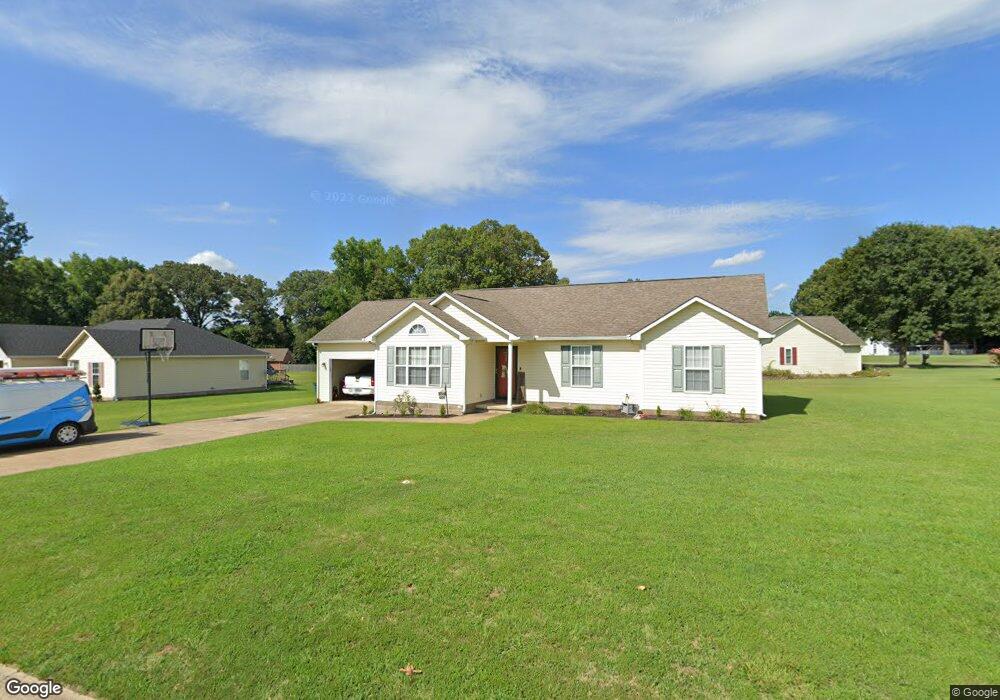
This home is located at 108 S Peck Switch Cove, Dyer, TN 38330 and is currently estimated at $164,004, approximately $131 per square foot. 108 S Peck Switch Cove is a home located in Gibson County with nearby schools including Dyer Elementary School and Gibson County High School.
Ownership History
Date
Name
Owned For
Owner Type
Purchase Details
Closed on
Dec 10, 2002
Sold by
Deaton Larry G and Deaton Patricia
Bought by
Nolan Brandon Kimberly
Current Estimated Value
Home Financials for this Owner
Home Financials are based on the most recent Mortgage that was taken out on this home.
Original Mortgage
$79,500
Outstanding Balance
$36,361
Interest Rate
6.07%
Estimated Equity
$127,643
Purchase Details
Closed on
Oct 16, 1998
Bought by
T & S Developers Inc & Billy & Patricia Neal
Create a Home Valuation Report for This Property
The Home Valuation Report is an in-depth analysis detailing your home's value as well as a comparison with similar homes in the area
Home Values in the Area
Average Home Value in this Area
Purchase History
| Date | Buyer | Sale Price | Title Company |
|---|---|---|---|
| Nolan Brandon Kimberly | $79,500 | -- | |
| T & S Developers Inc & Billy & Patricia Neal | $30,000 | -- |
Source: Public Records
Mortgage History
| Date | Status | Borrower | Loan Amount |
|---|---|---|---|
| Open | T & S Developers Inc & Billy & Patricia Neal | $79,500 |
Source: Public Records
Tax History Compared to Growth
Tax History
| Year | Tax Paid | Tax Assessment Tax Assessment Total Assessment is a certain percentage of the fair market value that is determined by local assessors to be the total taxable value of land and additions on the property. | Land | Improvement |
|---|---|---|---|---|
| 2025 | $1,233 | $35,575 | $0 | $0 |
| 2024 | $1,233 | $35,575 | $3,750 | $31,825 |
| 2023 | $700 | $22,475 | $2,500 | $19,975 |
| 2022 | $684 | $22,475 | $2,500 | $19,975 |
| 2021 | $684 | $22,475 | $2,500 | $19,975 |
| 2020 | $1,118 | $22,475 | $2,500 | $19,975 |
| 2019 | $1,117 | $22,475 | $2,500 | $19,975 |
| 2018 | $1,149 | $22,750 | $2,500 | $20,250 |
| 2017 | $1,103 | $22,750 | $2,500 | $20,250 |
| 2016 | $1,103 | $22,750 | $2,500 | $20,250 |
| 2015 | $1,004 | $22,750 | $2,500 | $20,250 |
| 2014 | $1,005 | $22,750 | $2,500 | $20,250 |
Source: Public Records
Map
Nearby Homes
- 106 Scattered Acres Dr
- 148 Scattered Acres Loop
- Tract 1 Trenton Hwy
- 0 Reed Rd
- 84 Trenton Hwy
- 246 Thomas St
- 342 E Walnut St
- 299 E Walnut St
- 217 Central St
- 0 Ernest Paschall Rd Unit 2500074
- 0 Ernest Paschall Rd Unit RRA45339
- 154 Elm St
- 354 E Maple St
- 142 S Poplar St
- 139 Peach St
- 163 Monroe St
- 505 E College St
- 385 Trenton Hwy
- 153 New Hope St
- 205 Division St
- 126 S Peck Switch Cove
- 105 S Peck Switch Cove
- 1165 S Main St
- 107 S Peck Switch Cove
- 138 S Peck Switch Cove
- 1171 S Main St
- 115 S Peck Switch Cove
- 1157 S Main St
- 127 S Peck Switch Cove
- 1179 S Main St
- 143 S Peck Switch Cove
- 1183 S Main St
- 150 Scattered Acres Dr
- 162 S Peck Switch Cove
- 170 Scattered Acres Dr
- 149 S Peck Switch Cove
- 1180 S Main St
- 135 S Peck Switch Cove
- 178 Scattered Acres Dr
- 1123 S Main St