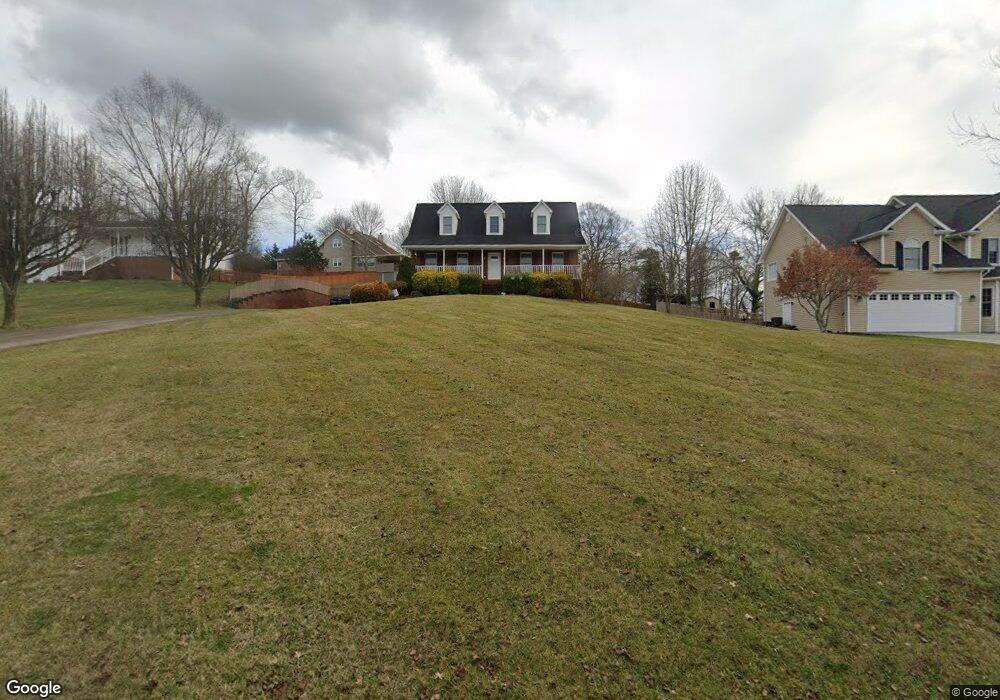
108 Silverleaf Ct Kingsport, TN 37664
Estimated Value: $390,000 - $506,000
3
Beds
3
Baths
2,514
Sq Ft
$174/Sq Ft
Est. Value
About This Home
This home is located at 108 Silverleaf Ct, Kingsport, TN 37664 and is currently estimated at $436,716, approximately $173 per square foot. 108 Silverleaf Ct is a home located in Sullivan County with nearby schools including Indian Springs Elementary School and Sullivan Central Middle School.
Ownership History
Date
Name
Owned For
Owner Type
Purchase Details
Closed on
Nov 18, 2015
Sold by
Prichett Dennis Day
Bought by
Dill Seth Breaden and Dill Amanda Dakota
Current Estimated Value
Home Financials for this Owner
Home Financials are based on the most recent Mortgage that was taken out on this home.
Original Mortgage
$188,000
Outstanding Balance
$148,072
Interest Rate
3.83%
Mortgage Type
New Conventional
Estimated Equity
$288,644
Purchase Details
Closed on
Aug 30, 2012
Sold by
Fletcher Brandon S
Bought by
Pritchett Dennis Day
Home Financials for this Owner
Home Financials are based on the most recent Mortgage that was taken out on this home.
Original Mortgage
$158,000
Interest Rate
2.88%
Mortgage Type
Commercial
Purchase Details
Closed on
Sep 26, 2003
Sold by
Samuel Fink and Samuel Kristie
Bought by
Fletcher Brandon S
Home Financials for this Owner
Home Financials are based on the most recent Mortgage that was taken out on this home.
Original Mortgage
$161,415
Interest Rate
6.32%
Create a Home Valuation Report for This Property
The Home Valuation Report is an in-depth analysis detailing your home's value as well as a comparison with similar homes in the area
Home Values in the Area
Average Home Value in this Area
Purchase History
| Date | Buyer | Sale Price | Title Company |
|---|---|---|---|
| Dill Seth Breaden | $235,000 | -- | |
| Pritchett Dennis Day | $198,000 | -- | |
| Fletcher Brandon S | $169,911 | -- |
Source: Public Records
Mortgage History
| Date | Status | Borrower | Loan Amount |
|---|---|---|---|
| Open | Dill Seth Breaden | $188,000 | |
| Previous Owner | Pritchett Dennis Day | $158,000 | |
| Previous Owner | Fletcher Brandon S | $161,415 |
Source: Public Records
Tax History Compared to Growth
Tax History
| Year | Tax Paid | Tax Assessment Tax Assessment Total Assessment is a certain percentage of the fair market value that is determined by local assessors to be the total taxable value of land and additions on the property. | Land | Improvement |
|---|---|---|---|---|
| 2024 | $1,521 | $60,925 | $6,875 | $54,050 |
| 2023 | $1,466 | $60,925 | $6,875 | $54,050 |
| 2022 | $1,466 | $60,925 | $6,875 | $54,050 |
| 2021 | $1,466 | $60,925 | $6,875 | $54,050 |
| 2020 | $1,279 | $60,925 | $6,875 | $54,050 |
| 2019 | $1,279 | $49,775 | $6,875 | $42,900 |
| 2018 | $1,269 | $49,775 | $6,875 | $42,900 |
| 2017 | $1,269 | $49,775 | $6,875 | $42,900 |
| 2016 | $1,250 | $48,525 | $6,875 | $41,650 |
| 2014 | $1,119 | $48,535 | $0 | $0 |
Source: Public Records
Map
Nearby Homes
- Lot 3 Country Dr
- Lot 2 Country Dr
- Lot 21 Country Dr
- 0 Moody Dr
- 121 Southridge Dr
- 128 Southridge Dr
- 295 Southridge Dr
- 5028 Dublin Rd
- 376 Cain Dr
- 160 Sugarcane Ln
- 509 Amelia Ct
- 172 Sugarcane Ln
- 5404 Memorial Blvd
- 845 Emory Church Rd
- 0 Foxfire Ln
- 5509 Memorial Blvd
- 416 S Valley View Cir
- Madison Plan at Fieldcrest Acres
- Salem Plan at Fieldcrest Acres
- Pamlico Plan at Fieldcrest Acres
- 112 Silverleaf Ct
- 104 Silverleaf Ct
- 204 Cloverleaf Ct
- Lot12 Silverleaf Ct
- LOT 8 Silverleaf Ct
- LOT 5 Silverleaf Ct
- LOT 3 Silverleaf Ct
- LOT 23 Silverleaf Ct
- LOT 1 Silverleaf Ct
- LOT 11 Silverleaf Ct
- 0 Silverleaf Ct
- LOT13 Silverleaf Ct
- LOT 24 Silverleaf Ct
- 00 Silverleaf Ct
- LOT 14 Silverleaf Ct
- 364 Bridwell Heights Rd
- 120 Silverleaf Ct
- 6 Silverleaf Ct
- 113 Silverleaf Ct
- 14 Silverleaf Ct Unit LOT 14