108 Turtle Cay Wilmington, NC 28412
River Road NeighborhoodEstimated Value: $440,000 - $467,000
3
Beds
3
Baths
1,846
Sq Ft
$246/Sq Ft
Est. Value
About This Home
This home is located at 108 Turtle Cay, Wilmington, NC 28412 and is currently estimated at $453,971, approximately $245 per square foot. 108 Turtle Cay is a home located in New Hanover County with nearby schools including Heyward C. Bellamy Elementary School, Charles P. Murray Middle School, and Eugene Ashley High School.
Ownership History
Date
Name
Owned For
Owner Type
Purchase Details
Closed on
Oct 31, 2018
Sold by
Smith Barbara T
Bought by
Bsl Land Holdings Llc
Current Estimated Value
Purchase Details
Closed on
May 30, 2014
Sold by
Ppc Ventures Llc
Bought by
Smith Robert E and Smith Barbara T
Home Financials for this Owner
Home Financials are based on the most recent Mortgage that was taken out on this home.
Original Mortgage
$80,000
Interest Rate
4.32%
Mortgage Type
New Conventional
Purchase Details
Closed on
Aug 1, 2011
Sold by
Beau Rivage Plantation Inc
Bought by
Ppc Ventures Llc
Purchase Details
Closed on
Feb 25, 2003
Sold by
S F Holdings Of Wilmington Llc
Bought by
Beau Rivage Plantation Inc
Purchase Details
Closed on
Oct 16, 2002
Sold by
Sanco Of Wilmington Ser Corp
Bought by
Sanders Nathan S Judia B
Purchase Details
Closed on
Feb 26, 1999
Sold by
Sanders Nathan S Judia B
Bought by
Sanco Of Wilmington Ser Corp
Create a Home Valuation Report for This Property
The Home Valuation Report is an in-depth analysis detailing your home's value as well as a comparison with similar homes in the area
Home Values in the Area
Average Home Value in this Area
Purchase History
| Date | Buyer | Sale Price | Title Company |
|---|---|---|---|
| Bsl Land Holdings Llc | $199,500 | None Available | |
| Smith Robert E | $248,000 | None Available | |
| Ppc Ventures Llc | -- | None Available | |
| Beau Rivage Plantation Inc | -- | -- | |
| S F Holdings Of Wilmington Llc | -- | -- | |
| Sanders Nathan S Judia B | -- | -- | |
| Sanco Of Wilmington Ser Corp | -- | -- |
Source: Public Records
Mortgage History
| Date | Status | Borrower | Loan Amount |
|---|---|---|---|
| Previous Owner | Smith Robert E | $80,000 |
Source: Public Records
Tax History Compared to Growth
Tax History
| Year | Tax Paid | Tax Assessment Tax Assessment Total Assessment is a certain percentage of the fair market value that is determined by local assessors to be the total taxable value of land and additions on the property. | Land | Improvement |
|---|---|---|---|---|
| 2025 | $1,698 | $448,600 | $0 | $448,600 |
| 2024 | $1,329 | $254,300 | $0 | $254,300 |
| 2023 | $1,329 | $254,300 | $0 | $254,300 |
| 2022 | $1,341 | $254,300 | $0 | $254,300 |
| 2021 | $1,392 | $254,300 | $0 | $254,300 |
| 2020 | $1,282 | $202,700 | $0 | $202,700 |
| 2019 | $1,282 | $202,700 | $0 | $202,700 |
| 2018 | $1,282 | $202,700 | $0 | $202,700 |
| 2017 | $1,312 | $202,700 | $0 | $202,700 |
| 2016 | $1,235 | $178,200 | $0 | $178,200 |
| 2015 | $1,148 | $178,200 | $0 | $178,200 |
| 2014 | $1,128 | $178,200 | $0 | $178,200 |
Source: Public Records
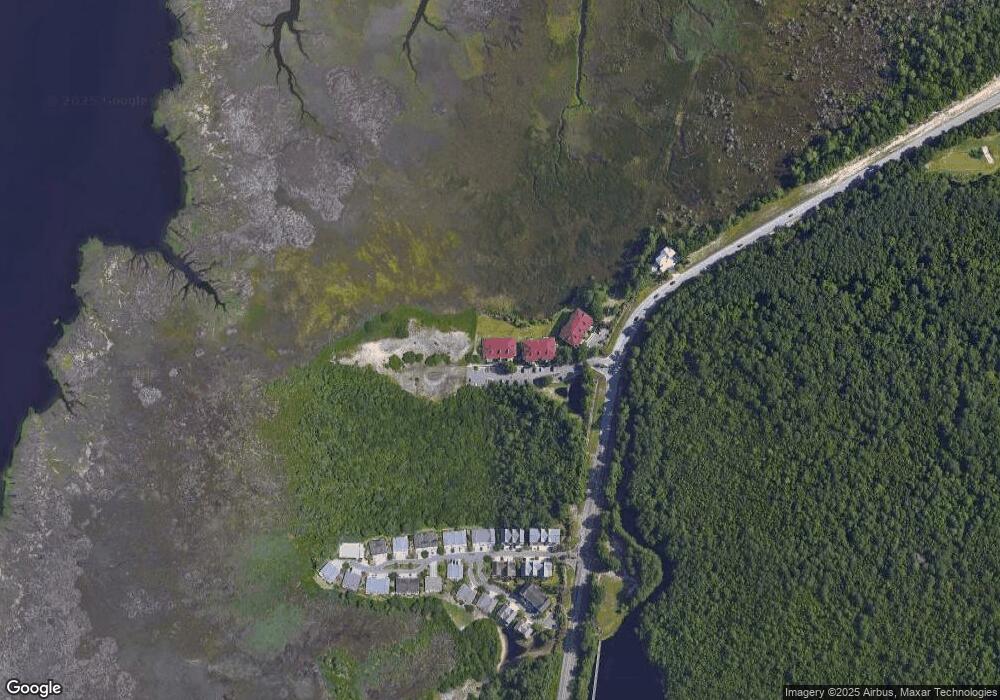
Map
Nearby Homes
- 9102 River Rd
- 6424 River Vista Dr
- 4630 Sweet Jasmine Run
- 6531 Shark Tooth Trail
- 429 Island End Ct
- 112 Pitch Pine Ct
- 433 Island End Ct
- 311 Chattooga Place
- 5704 Moonshell Loop
- 217 Paddle Ct
- 344 Keepsake Dr Unit 1269
- 5621 Coral Tide Ave Unit 1235g
- 357 Keepsake Dr Unit 1274
- 349 Keepsake Dr Unit 1276
- 5607 Coral Tide Ave Unit 1240g
- 5931 Moonshell Loop Unit 1225
- 337 Keepsake Dr Unit 1279
- 6116 Seagrove Ct
- 341 Keepsake Dr Unit 1278
- 6112 Seagrove Ct
- 108 Turtle Cay Unit 5
- 108 Turtle Cay Unit 6
- 108 Turtle Cay Unit 9
- 108 Turtle Cay Unit 8
- 108 Turtle Cay
- 108 Turtle Cay
- 108 Turtle Cay
- 108 Turtle Cay
- 108 Turtle Cay
- 108 Turtle Cay Unit 2
- 108 Turtle Cay Unit 3
- 108 Turtle Cay Unit 1
- 104 Turtle Cay Unit 9
- 104 Turtle Cay Unit 4
- 104 Turtle Cay Unit 8
- 104 Turtle Cay
- 104 Turtle Cay Unit 12
- 104 Turtle Cay Unit 7
- 104 Turtle Cay Unit 6
- 104 Turtle Cay Unit 1