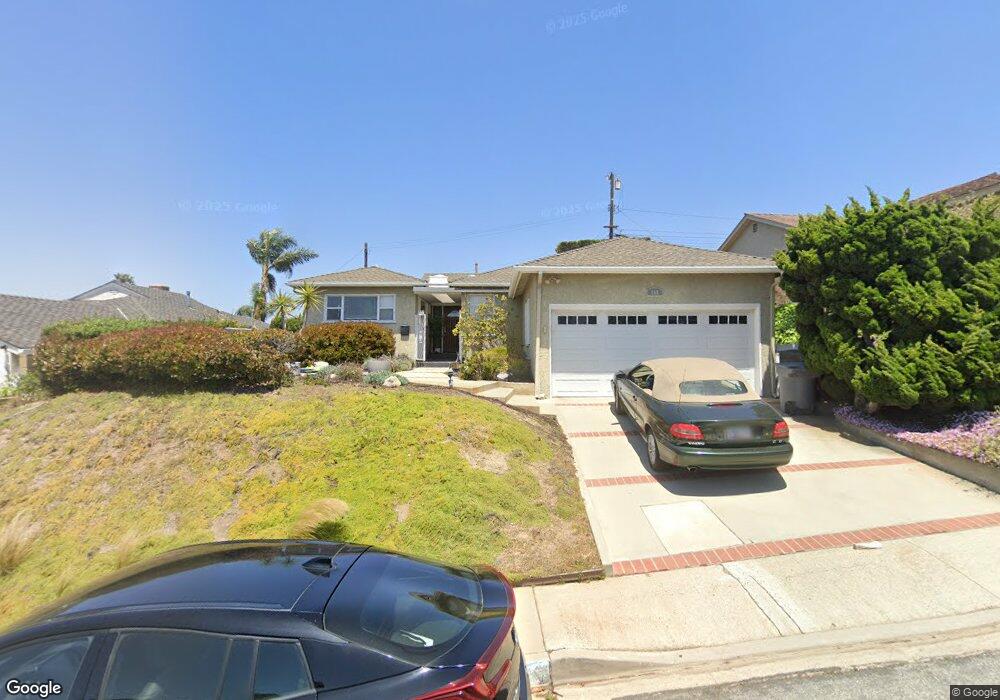
108 Via la Soledad Redondo Beach, CA 90277
Riviera NeighborhoodEstimated Value: $2,219,671 - $2,664,000
4
Beds
3
Baths
2,231
Sq Ft
$1,122/Sq Ft
Est. Value
About This Home
This home is located at 108 Via la Soledad, Redondo Beach, CA 90277 and is currently estimated at $2,502,168, approximately $1,121 per square foot. 108 Via la Soledad is a home located in Los Angeles County with nearby schools including Riviera Elementary School, Edward J. Richardson Middle School, and South High School.
Ownership History
Date
Name
Owned For
Owner Type
Purchase Details
Closed on
Feb 18, 2010
Sold by
Shapiro Ralph H and The Shapiro Bypass Trust
Bought by
Niswander Troy and Bell Maia
Current Estimated Value
Home Financials for this Owner
Home Financials are based on the most recent Mortgage that was taken out on this home.
Original Mortgage
$75,000
Interest Rate
4.97%
Mortgage Type
Seller Take Back
Purchase Details
Closed on
Dec 8, 2005
Sold by
Shapiro Ralph H and Ralph & Jean Shapiro Trust
Bought by
Shapiro Ralph H and Shapiro Survivors Trust
Purchase Details
Closed on
Apr 10, 2003
Sold by
Shapiro Ralph H and Shapiro Jean M
Bought by
Shapiro Ralph H and Shapiro Jean M
Home Financials for this Owner
Home Financials are based on the most recent Mortgage that was taken out on this home.
Original Mortgage
$322,700
Interest Rate
5.6%
Create a Home Valuation Report for This Property
The Home Valuation Report is an in-depth analysis detailing your home's value as well as a comparison with similar homes in the area
Home Values in the Area
Average Home Value in this Area
Purchase History
| Date | Buyer | Sale Price | Title Company |
|---|---|---|---|
| Niswander Troy | -- | Fidelity Van Nuys | |
| Shapiro Ralph H | -- | -- | |
| Shapiro Ralph H | -- | -- | |
| Shapiro Ralph H | -- | Fidelity National Title Co | |
| Shapiro Ralph H | -- | Fidelity National Title Co |
Source: Public Records
Mortgage History
| Date | Status | Borrower | Loan Amount |
|---|---|---|---|
| Previous Owner | Niswander Troy | $75,000 | |
| Previous Owner | Shapiro Ralph H | $322,700 |
Source: Public Records
Tax History Compared to Growth
Tax History
| Year | Tax Paid | Tax Assessment Tax Assessment Total Assessment is a certain percentage of the fair market value that is determined by local assessors to be the total taxable value of land and additions on the property. | Land | Improvement |
|---|---|---|---|---|
| 2025 | $1,966 | $146,059 | $76,708 | $69,351 |
| 2024 | $1,966 | $143,196 | $75,204 | $67,992 |
| 2023 | $1,939 | $140,389 | $73,730 | $66,659 |
| 2022 | $1,916 | $137,637 | $72,285 | $65,352 |
| 2021 | $1,932 | $134,939 | $70,868 | $64,071 |
| 2019 | $1,882 | $130,939 | $68,767 | $62,172 |
| 2018 | $1,762 | $128,372 | $67,419 | $60,953 |
| 2016 | $1,665 | $123,389 | $64,802 | $58,587 |
| 2015 | $1,633 | $121,536 | $63,829 | $57,707 |
| 2014 | $1,607 | $119,156 | $62,579 | $56,577 |
Source: Public Records
Map
Nearby Homes
- 111 Calle Mayor
- 426 Via la Selva
- 424 Camino de Encanto
- 320 Calle Mayor
- 411 Via Mesa Grande
- 417 Via la Soledad
- 438 Calle de Aragon
- 163 Paseo de la Concha Unit 4
- 163 Paseo de la Concha Unit 1
- 2737 Via la Selva
- 433 Paseo de la Playa
- 237 Via Los Miradores
- 204 Via Colusa
- 445 Calle Mayor
- 2709
- 201 Calle Miramar Unit 8
- 201 Calle Miramar Unit 16
- 639 Paseo de la Playa Unit 107
- 649 Paseo de la Playa Unit 303
- 118 Via Buena Ventura
- 114 Via la Soledad
- 102 Via la Soledad
- 228 Calle Mayor
- 120 Via la Soledad
- 229 Via Monte Doro
- 109 Via la Soledad
- 103 Via la Soledad
- 234 Calle Mayor
- 115 Via la Soledad
- 233 Via Monte Doro
- 126 Via la Soledad
- 121 Via la Soledad
- 301 Via Monte Doro
- 238 Calle Mayor
- 125 Via la Soledad
- 132 Via la Soledad
- 102 Via Mesa Grande
- 108 Via Mesa Grande
- 231 Calle Mayor
- 114 Via Mesa Grande