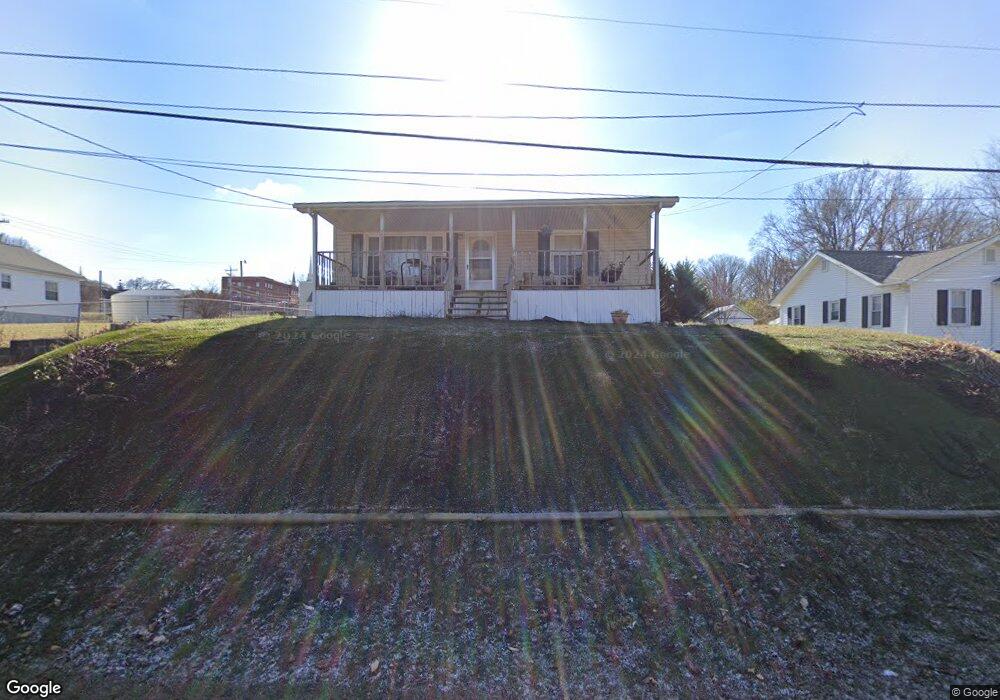
108 W Doe Ave Elizabethton, TN 37643
Estimated Value: $141,000 - $189,000
--
Bed
1
Bath
908
Sq Ft
$172/Sq Ft
Est. Value
About This Home
This home is located at 108 W Doe Ave, Elizabethton, TN 37643 and is currently estimated at $155,982, approximately $171 per square foot. 108 W Doe Ave is a home located in Carter County with nearby schools including Elizabethton High School and East Tn Christian Home & Academy.
Ownership History
Date
Name
Owned For
Owner Type
Purchase Details
Closed on
Aug 5, 1998
Sold by
Jaynes Neal O
Bought by
Potter Paula
Current Estimated Value
Purchase Details
Closed on
Oct 7, 1996
Sold by
Bowden Tom
Bought by
Jaynes Neal
Home Financials for this Owner
Home Financials are based on the most recent Mortgage that was taken out on this home.
Original Mortgage
$41,000
Interest Rate
7.87%
Purchase Details
Closed on
Jan 1, 1984
Bought by
Bowden Tom and Bowden Janice
Create a Home Valuation Report for This Property
The Home Valuation Report is an in-depth analysis detailing your home's value as well as a comparison with similar homes in the area
Home Values in the Area
Average Home Value in this Area
Purchase History
| Date | Buyer | Sale Price | Title Company |
|---|---|---|---|
| Potter Paula | $47,500 | -- | |
| Jaynes Neal | $37,500 | -- | |
| Bowden Tom | $29,900 | -- |
Source: Public Records
Mortgage History
| Date | Status | Borrower | Loan Amount |
|---|---|---|---|
| Previous Owner | Bowden Tom | $41,000 |
Source: Public Records
Tax History Compared to Growth
Tax History
| Year | Tax Paid | Tax Assessment Tax Assessment Total Assessment is a certain percentage of the fair market value that is determined by local assessors to be the total taxable value of land and additions on the property. | Land | Improvement |
|---|---|---|---|---|
| 2024 | $814 | $24,650 | $8,175 | $16,475 |
| 2023 | $814 | $24,650 | $0 | $0 |
| 2022 | $887 | $24,650 | $8,175 | $16,475 |
| 2021 | $500 | $24,650 | $8,175 | $16,475 |
| 2020 | $738 | $24,650 | $8,175 | $16,475 |
| 2019 | $738 | $17,100 | $3,650 | $13,450 |
| 2018 | $728 | $17,100 | $3,650 | $13,450 |
| 2017 | $723 | $17,100 | $3,650 | $13,450 |
| 2016 | $720 | $16,975 | $3,650 | $13,325 |
| 2015 | $721 | $16,975 | $3,650 | $13,325 |
| 2014 | $769 | $18,000 | $3,650 | $14,350 |
Source: Public Records
Map
Nearby Homes