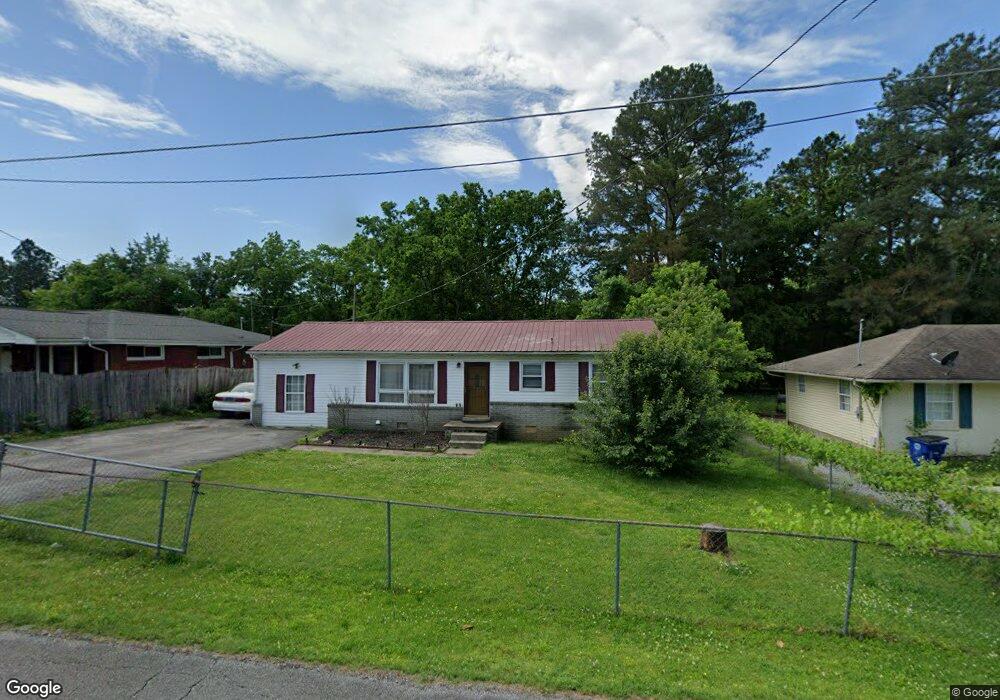
108 Whiteside St Shelbyville, TN 37160
Estimated Value: $178,908 - $238,000
--
Bed
1
Bath
1,272
Sq Ft
$160/Sq Ft
Est. Value
About This Home
This home is located at 108 Whiteside St, Shelbyville, TN 37160 and is currently estimated at $203,727, approximately $160 per square foot. 108 Whiteside St is a home located in Bedford County with nearby schools including South Side Elementary School, Harris Middle School, and Christian Chapel Academy.
Ownership History
Date
Name
Owned For
Owner Type
Purchase Details
Closed on
Dec 4, 2009
Sold by
Midfirst Bank
Bought by
Ray Joel S
Current Estimated Value
Purchase Details
Closed on
Oct 14, 2009
Sold by
Marsh Sharon Lokey
Bought by
Midfirst Bank
Purchase Details
Closed on
Jul 14, 2003
Sold by
Parder Kurt
Bought by
Marsh Sharon Lokey
Home Financials for this Owner
Home Financials are based on the most recent Mortgage that was taken out on this home.
Original Mortgage
$72,081
Interest Rate
5.16%
Purchase Details
Closed on
Nov 7, 1995
Sold by
Flippo Steven R
Bought by
Pierce Greg
Purchase Details
Closed on
Jan 19, 1989
Bought by
Flippo Steven R
Purchase Details
Closed on
Nov 10, 1988
Bought by
Flippo Belton R and Flippo Vera F
Purchase Details
Closed on
Dec 6, 1983
Bought by
Cook Cook R and Cook Melanie S
Create a Home Valuation Report for This Property
The Home Valuation Report is an in-depth analysis detailing your home's value as well as a comparison with similar homes in the area
Home Values in the Area
Average Home Value in this Area
Purchase History
| Date | Buyer | Sale Price | Title Company |
|---|---|---|---|
| Ray Joel S | $58,700 | -- | |
| Midfirst Bank | $52,700 | -- | |
| Marsh Sharon Lokey | $71,000 | -- | |
| Pierce Greg | $48,500 | -- | |
| Flippo Steven R | -- | -- | |
| Flippo Belton R | -- | -- | |
| Cook Cook R | -- | -- |
Source: Public Records
Mortgage History
| Date | Status | Borrower | Loan Amount |
|---|---|---|---|
| Previous Owner | Cook Cook R | $72,081 |
Source: Public Records
Tax History Compared to Growth
Tax History
| Year | Tax Paid | Tax Assessment Tax Assessment Total Assessment is a certain percentage of the fair market value that is determined by local assessors to be the total taxable value of land and additions on the property. | Land | Improvement |
|---|---|---|---|---|
| 2025 | -- | $29,325 | $0 | $0 |
| 2024 | -- | $29,325 | $8,500 | $20,825 |
| 2023 | $434 | $29,325 | $8,500 | $20,825 |
| 2022 | $1,148 | $29,325 | $8,500 | $20,825 |
| 2021 | $1,042 | $29,325 | $8,500 | $20,825 |
| 2020 | $766 | $29,325 | $8,500 | $20,825 |
| 2019 | $766 | $17,300 | $3,500 | $13,800 |
| 2018 | $749 | $17,300 | $3,500 | $13,800 |
| 2017 | $749 | $17,300 | $3,500 | $13,800 |
| 2016 | $742 | $17,300 | $3,500 | $13,800 |
| 2015 | $742 | $17,300 | $3,500 | $13,800 |
| 2014 | $659 | $16,801 | $0 | $0 |
Source: Public Records
Map
Nearby Homes
- 110 Whiteside St
- 111 Hight St
- 109 Hight St
- 111 Whiteside St
- 104 Whiteside St
- 113 Hight St
- 113 Whiteside St
- 105 Hight St
- 105 Whiteside St
- 115 Hight St
- 115 Whiteside St
- 114 Whiteside St
- 1205 S Cannon Blvd
- 102 Whiteside St
- 1207 S Cannon Blvd
- 117 Hight St
- 1101 S Cannon Blvd
- 103 Whiteside St
- 1209 S Cannon Blvd
- 117 Whiteside St