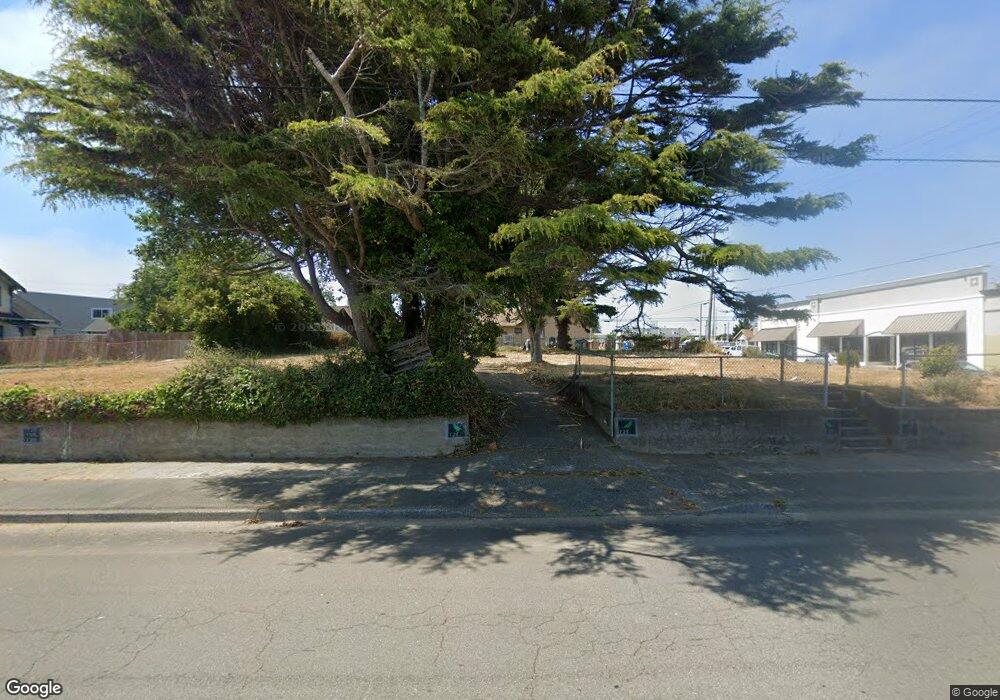
1080 4th St Crescent City, CA 95531
Estimated Value: $69,379
3
Beds
3
Baths
2,125
Sq Ft
$33/Sq Ft
Est. Value
About This Home
This home is located at 1080 4th St, Crescent City, CA 95531 and is currently estimated at $69,379, approximately $32 per square foot. 1080 4th St is a home located in Del Norte County with nearby schools including Joe Hamilton Elementary School, Crescent Elk Middle School, and Del Norte High School.
Ownership History
Date
Name
Owned For
Owner Type
Purchase Details
Closed on
Jan 12, 2022
Sold by
Crescent City Properties Llc
Bought by
Groom Family Trust
Current Estimated Value
Purchase Details
Closed on
Dec 12, 2013
Sold by
Charleston Esther L
Bought by
Crescent City Properties Llc
Home Financials for this Owner
Home Financials are based on the most recent Mortgage that was taken out on this home.
Original Mortgage
$30,000
Interest Rate
4.04%
Mortgage Type
Seller Take Back
Purchase Details
Closed on
Aug 4, 2011
Sold by
Charleston Charles N and Charleston Esther L
Bought by
Charleston Charles N and Charleston Esther L
Create a Home Valuation Report for This Property
The Home Valuation Report is an in-depth analysis detailing your home's value as well as a comparison with similar homes in the area
Home Values in the Area
Average Home Value in this Area
Purchase History
| Date | Buyer | Sale Price | Title Company |
|---|---|---|---|
| Groom Family Trust | $68,000 | None Listed On Document | |
| Crescent City Properties Llc | $35,000 | Crescent Land Title Company | |
| Charleston Charles N | -- | None Available |
Source: Public Records
Mortgage History
| Date | Status | Borrower | Loan Amount |
|---|---|---|---|
| Previous Owner | Crescent City Properties Llc | $30,000 |
Source: Public Records
Tax History Compared to Growth
Tax History
| Year | Tax Paid | Tax Assessment Tax Assessment Total Assessment is a certain percentage of the fair market value that is determined by local assessors to be the total taxable value of land and additions on the property. | Land | Improvement |
|---|---|---|---|---|
| 2025 | $740 | $72,161 | $72,161 | -- |
| 2024 | $740 | $70,747 | $70,747 | -- |
| 2023 | $724 | $69,360 | $69,360 | $0 |
| 2022 | $421 | $40,427 | $40,427 | $0 |
| 2021 | $419 | $39,635 | $39,635 | $0 |
| 2020 | $416 | $39,229 | $39,229 | $0 |
| 2019 | $409 | $38,460 | $38,460 | $0 |
| 2018 | $400 | $37,706 | $37,706 | $0 |
| 2017 | $394 | $36,967 | $36,967 | $0 |
| 2016 | $387 | $36,243 | $36,243 | $0 |
| 2015 | $378 | $35,699 | $35,699 | $0 |
| 2014 | $374 | $35,000 | $35,000 | $0 |
Source: Public Records
Map
Nearby Homes