1080 New Haven Ave Unit 96 Milford, CT 06460
Woodmont NeighborhoodEstimated Value: $220,000 - $222,711
2
Beds
2
Baths
963
Sq Ft
$229/Sq Ft
Est. Value
About This Home
This home is located at 1080 New Haven Ave Unit 96, Milford, CT 06460 and is currently estimated at $220,928, approximately $229 per square foot. 1080 New Haven Ave Unit 96 is a home located in New Haven County with nearby schools including Orchard Hills School, East Shore Middle School, and Joseph A. Foran High School.
Ownership History
Date
Name
Owned For
Owner Type
Purchase Details
Closed on
Aug 1, 2007
Sold by
Ivanov Alekski and Kopytina Elena
Bought by
Benedetto Earl B
Current Estimated Value
Home Financials for this Owner
Home Financials are based on the most recent Mortgage that was taken out on this home.
Original Mortgage
$35,000
Interest Rate
6.24%
Purchase Details
Closed on
Jul 15, 2004
Sold by
Parsons William and Parsons Nora
Bought by
Poulos Andrea H
Home Financials for this Owner
Home Financials are based on the most recent Mortgage that was taken out on this home.
Original Mortgage
$135,700
Interest Rate
6.25%
Purchase Details
Closed on
May 18, 1998
Sold by
Gebing Roberg K and Gebing Sandra P
Bought by
Parsons William and Parsons Nora
Home Financials for this Owner
Home Financials are based on the most recent Mortgage that was taken out on this home.
Original Mortgage
$39,000
Interest Rate
7.08%
Mortgage Type
Unknown
Create a Home Valuation Report for This Property
The Home Valuation Report is an in-depth analysis detailing your home's value as well as a comparison with similar homes in the area
Home Values in the Area
Average Home Value in this Area
Purchase History
| Date | Buyer | Sale Price | Title Company |
|---|---|---|---|
| Benedetto Earl B | $170,000 | -- | |
| Poulos Andrea H | $139,900 | -- | |
| Poulos Andrea H | $139,900 | -- | |
| Parsons William | $52,000 | -- | |
| Parsons William | $52,000 | -- |
Source: Public Records
Mortgage History
| Date | Status | Borrower | Loan Amount |
|---|---|---|---|
| Previous Owner | Parsons William | $35,000 | |
| Previous Owner | Parsons William | $135,700 | |
| Previous Owner | Parsons William | $39,000 |
Source: Public Records
Tax History Compared to Growth
Tax History
| Year | Tax Paid | Tax Assessment Tax Assessment Total Assessment is a certain percentage of the fair market value that is determined by local assessors to be the total taxable value of land and additions on the property. | Land | Improvement |
|---|---|---|---|---|
| 2025 | $3,006 | $101,730 | $0 | $101,730 |
| 2024 | $2,964 | $101,730 | $0 | $101,730 |
| 2023 | $2,764 | $101,730 | $0 | $101,730 |
| 2022 | $2,711 | $101,730 | $0 | $101,730 |
| 2021 | $2,386 | $86,280 | $0 | $86,280 |
| 2020 | $2,388 | $86,280 | $0 | $86,280 |
| 2019 | $2,391 | $86,280 | $0 | $86,280 |
| 2018 | $2,393 | $86,280 | $0 | $86,280 |
| 2017 | $2,398 | $86,280 | $0 | $86,280 |
| 2016 | $2,675 | $96,100 | $0 | $96,100 |
| 2015 | $2,679 | $96,100 | $0 | $96,100 |
| 2014 | -- | $96,100 | $0 | $96,100 |
Source: Public Records
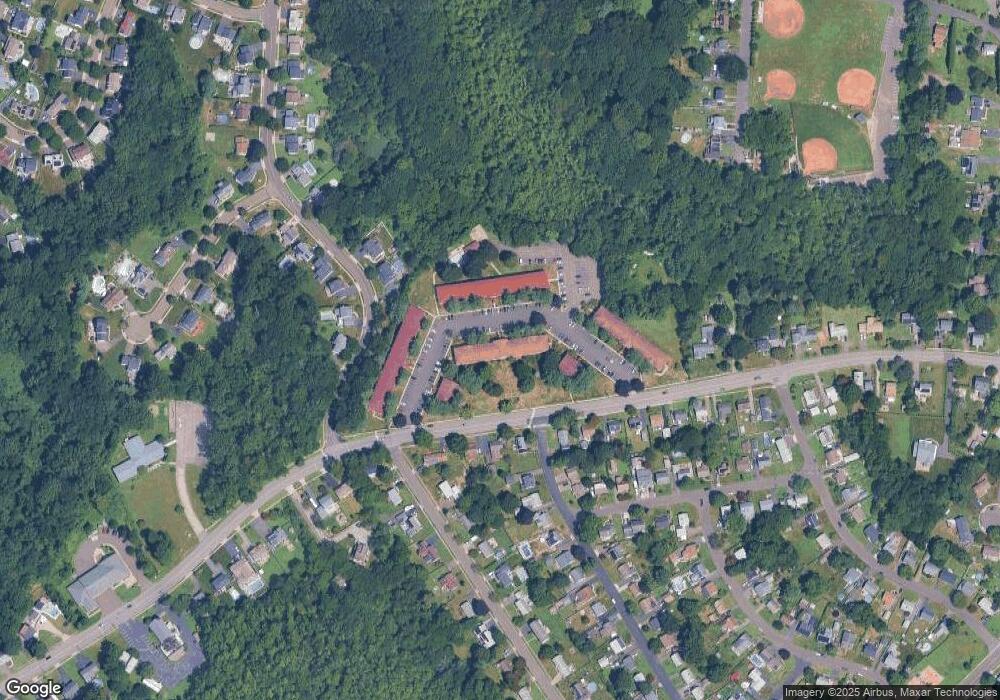
Map
Nearby Homes
- 29 Meetinghouse Ln
- 15 Alpha St
- 35 Whippoorwill Dr
- 10 Sperry St
- 99 Timber Trail
- 207 Merwin Ave
- 36 Kenwood Rd
- 822 New Haven Ave
- 62 Soundview Ave
- 583 Anderson Ave
- 44 Clark Hill Rd
- 30 Salem Walk
- 44 Columbia Dr
- 170 Kings Hwy
- 152 Beach Ave
- 157 Kings Hwy Unit E
- 32 Burwell Ave
- 26 Riverdale Rd
- 25 Village Rd
- 126 Baxter Ln
- 1080 New Haven Ave Unit 114
- 1080 New Haven Ave Unit 113
- 1080 New Haven Ave Unit 112
- 1080 New Haven Ave Unit 111
- 1080 New Haven Ave Unit 110
- 1080 New Haven Ave Unit 109
- 1080 New Haven Ave Unit 108
- 1080 New Haven Ave Unit 107
- 1080 New Haven Ave Unit 105
- 1080 New Haven Ave Unit 104
- 1080 New Haven Ave Unit 103
- 1080 New Haven Ave Unit 102
- 1080 New Haven Ave Unit 101
- 1080 New Haven Ave Unit 99
- 1080 New Haven Ave Unit 98
- 1080 New Haven Ave Unit 97
- 1080 New Haven Ave Unit 95
- 1080 New Haven Ave Unit 94
- 1080 New Haven Ave Unit 93
- 1080 New Haven Ave Unit 92