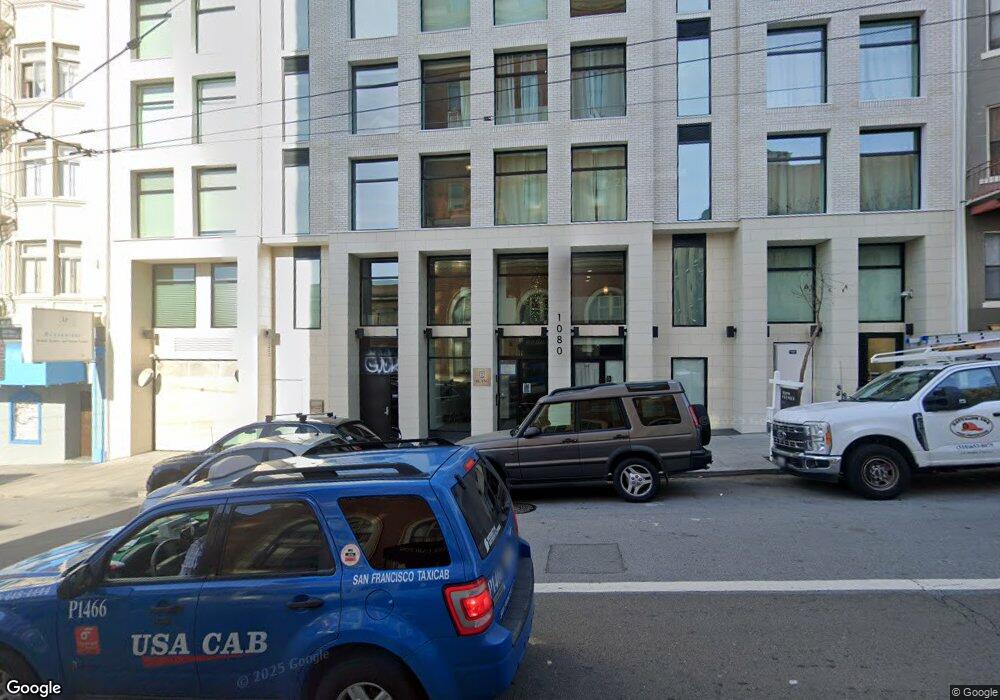
1080 Sutter St Unit 503 San Francisco, CA 94109
Downtown NeighborhoodEstimated Value: $675,000 - $850,000
2
Beds
1
Bath
750
Sq Ft
$1,042/Sq Ft
Est. Value
About This Home
This home is located at 1080 Sutter St Unit 503, San Francisco, CA 94109 and is currently estimated at $781,401, approximately $1,041 per square foot. 1080 Sutter St Unit 503 is a home located in San Francisco County with nearby schools including Redding Elementary School, Marina Middle School, and Cathedral School for Boys.
Ownership History
Date
Name
Owned For
Owner Type
Purchase Details
Closed on
Nov 14, 2025
Sold by
Li Joshua
Bought by
Li-Zhao Family Trust and Li
Current Estimated Value
Purchase Details
Closed on
Dec 23, 2016
Sold by
Patel Nandkishor M and Parmar Patel Geeta
Bought by
Li Joshua
Home Financials for this Owner
Home Financials are based on the most recent Mortgage that was taken out on this home.
Original Mortgage
$625,500
Interest Rate
4.03%
Mortgage Type
New Conventional
Purchase Details
Closed on
Aug 28, 2015
Sold by
Patel Nandkishor M and Parmar Patel Geeta
Bought by
Nandu & Geeta Patel Revocable Trust and Parmar Patel Geeta
Purchase Details
Closed on
Nov 6, 2013
Sold by
1080 Sutter Street Llc
Bought by
Patel Nandkishor M and Parmar Patel Geeta
Home Financials for this Owner
Home Financials are based on the most recent Mortgage that was taken out on this home.
Original Mortgage
$300,000
Interest Rate
3.62%
Mortgage Type
Adjustable Rate Mortgage/ARM
Create a Home Valuation Report for This Property
The Home Valuation Report is an in-depth analysis detailing your home's value as well as a comparison with similar homes in the area
Home Values in the Area
Average Home Value in this Area
Purchase History
| Date | Buyer | Sale Price | Title Company |
|---|---|---|---|
| Li-Zhao Family Trust | -- | None Listed On Document | |
| Li Joshua | $799,000 | Stewart Title Of Ca Inc | |
| Nandu & Geeta Patel Revocable Trust | -- | None Available | |
| Patel Nandkishor M | -- | None Available | |
| Patel Nandkishor M | $649,000 | First American Title Company |
Source: Public Records
Mortgage History
| Date | Status | Borrower | Loan Amount |
|---|---|---|---|
| Previous Owner | Li Joshua | $625,500 | |
| Previous Owner | Patel Nandkishor M | $300,000 |
Source: Public Records
Tax History
| Year | Tax Paid | Tax Assessment Tax Assessment Total Assessment is a certain percentage of the fair market value that is determined by local assessors to be the total taxable value of land and additions on the property. | Land | Improvement |
|---|---|---|---|---|
| 2025 | $11,439 | $927,300 | $463,650 | $463,650 |
| 2024 | $11,439 | $909,118 | $454,559 | $454,559 |
| 2023 | $11,263 | $891,294 | $445,647 | $445,647 |
| 2022 | $11,041 | $873,818 | $436,909 | $436,909 |
| 2021 | $10,844 | $856,686 | $428,343 | $428,343 |
| 2020 | $10,902 | $847,902 | $423,951 | $423,951 |
| 2019 | $10,530 | $831,278 | $415,639 | $415,639 |
| 2018 | $10,177 | $814,980 | $407,490 | $407,490 |
| 2017 | $8,428 | $685,500 | $342,750 | $342,750 |
| 2016 | $8,277 | $672,056 | $336,028 | $336,028 |
| 2015 | $8,174 | $661,964 | $330,982 | $330,982 |
Source: Public Records
Map
Nearby Homes
- 970 Post St
- 81 Frank Norris St Unit 705
- 1238 Sutter St Unit 505
- 1338 Larkin St
- 1433 Bush St Unit 502
- 1433 Bush St Unit 504
- 953 Leavenworth St
- 1545 Pine St Unit 1104
- 1545 Pine St Unit 610
- 1545 Pine St Unit 706
- 735 Geary St Unit 104
- 735 Geary St Unit 303
- 1 Helen St
- 1163 Pine St
- 832 Sutter St Unit 304
- 1155 Pine St Unit 17
- 1155 Pine St Unit 6
- 545 Leavenworth St Unit 1
- 1 Daniel Burnham Ct Unit 816
- 1 Daniel Burnham Ct Unit 617
- 1080 Sutter St
- 1080 Sutter St Unit 702
- 1080 Sutter St
- 1080 Sutter St Unit 1002
- 1080 Sutter St Unit 804
- 1080 Sutter St Unit 604
- 1080 Sutter St Unit 202
- 1080 Sutter St Unit 801
- 1080 Sutter St Unit 1003
- 1080 Sutter St Unit 1001
- 1080 Sutter St Unit 404
- 1080 Sutter St Unit 301
- 1080 Sutter St Unit CU-1
- 1080 Sutter St Unit 403
- 1080 Sutter St Unit 602
- 1080 Sutter St Unit 401
- 1080 Sutter St Unit 803
- 1080 Sutter St Unit 802
- 1080 Sutter St Unit 504
- 1080 Sutter St Unit 1101
Your Personal Tour Guide
Ask me questions while you tour the home.