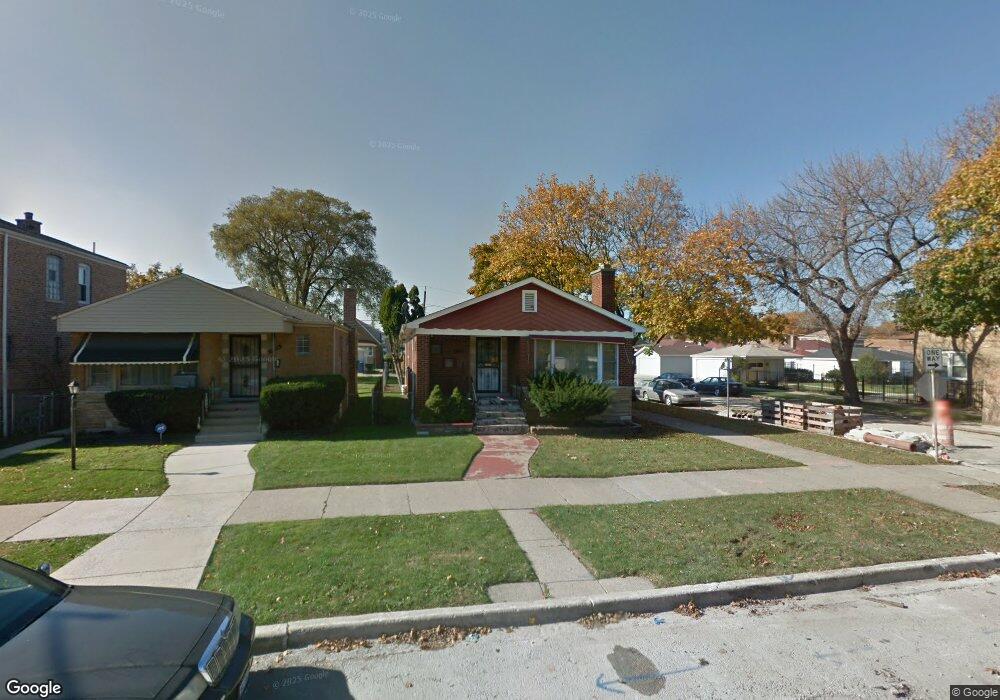
10800 S Eberhart Ave Chicago, IL 60628
Roseland NeighborhoodEstimated Value: $190,000 - $306,000
3
Beds
2
Baths
1,239
Sq Ft
$187/Sq Ft
Est. Value
About This Home
This home is located at 10800 S Eberhart Ave, Chicago, IL 60628 and is currently estimated at $231,590, approximately $186 per square foot. 10800 S Eberhart Ave is a home located in Cook County with nearby schools including Countee Cullen Elementary School, Corliss High School, and CICS Prairie.
Ownership History
Date
Name
Owned For
Owner Type
Purchase Details
Closed on
Nov 18, 2009
Sold by
Jones Isaac and Jones Pennie
Bought by
Jones Issac and Jones Pennie
Current Estimated Value
Home Financials for this Owner
Home Financials are based on the most recent Mortgage that was taken out on this home.
Original Mortgage
$167,359
Outstanding Balance
$107,041
Interest Rate
4.84%
Mortgage Type
FHA
Estimated Equity
$124,549
Purchase Details
Closed on
Sep 22, 2000
Sold by
Cooper Pennie P
Bought by
Jones Isaac and Jones Pennie
Home Financials for this Owner
Home Financials are based on the most recent Mortgage that was taken out on this home.
Original Mortgage
$28,400
Interest Rate
12%
Mortgage Type
Stand Alone Second
Purchase Details
Closed on
Aug 24, 1998
Sold by
Cooper Pennie P and Martin Ruthie A
Bought by
Cooper Pennie P
Home Financials for this Owner
Home Financials are based on the most recent Mortgage that was taken out on this home.
Original Mortgage
$70,000
Interest Rate
7.04%
Create a Home Valuation Report for This Property
The Home Valuation Report is an in-depth analysis detailing your home's value as well as a comparison with similar homes in the area
Home Values in the Area
Average Home Value in this Area
Purchase History
| Date | Buyer | Sale Price | Title Company |
|---|---|---|---|
| Jones Issac | -- | Stewart Title Guaranty Co | |
| Jones Isaac | -- | Oconnor Title Services Inc | |
| Cooper Pennie P | -- | -- |
Source: Public Records
Mortgage History
| Date | Status | Borrower | Loan Amount |
|---|---|---|---|
| Open | Jones Issac | $167,359 | |
| Closed | Jones Isaac | $28,400 | |
| Previous Owner | Cooper Pennie P | $70,000 |
Source: Public Records
Tax History
| Year | Tax Paid | Tax Assessment Tax Assessment Total Assessment is a certain percentage of the fair market value that is determined by local assessors to be the total taxable value of land and additions on the property. | Land | Improvement |
|---|---|---|---|---|
| 2025 | $2,048 | $14,000 | $6,998 | $7,002 |
| 2024 | $2,048 | $14,000 | $6,998 | $7,002 |
| 2023 | $1,976 | $13,000 | $5,993 | $7,007 |
| 2022 | $1,976 | $13,000 | $5,993 | $7,007 |
| 2021 | $1,950 | $13,000 | $5,993 | $7,007 |
| 2020 | $1,812 | $11,218 | $3,688 | $7,530 |
| 2019 | $1,820 | $12,465 | $3,688 | $8,777 |
| 2018 | $1,788 | $12,465 | $3,688 | $8,777 |
| 2017 | $2,261 | $13,856 | $3,227 | $10,629 |
| 2016 | $2,280 | $13,856 | $3,227 | $10,629 |
| 2015 | $2,063 | $13,856 | $3,227 | $10,629 |
| 2014 | $1,846 | $12,495 | $2,766 | $9,729 |
| 2013 | $1,798 | $12,495 | $2,766 | $9,729 |
Source: Public Records
Map
Nearby Homes
- 10841 S Vernon Ave
- 519 E 109th St
- 10747 S King Dr
- 10755 S Champlain Ave
- 10947 S King Dr
- 10734 S Langley Ave
- 10710 S Langley Ave
- 10714 S Calumet Ave
- 11022 S Vernon Ave
- 10606 S Vernon Ave
- 10611 S Cottage Grove Ave
- 10721 S Prairie Ave
- 10614 S Langley Ave
- 10537 S Rhodes Ave
- 10742 S Prairie Ave
- 10734 S Prairie Ave
- 10626 S Prairie Ave
- 715 E 105th Place
- 10558 S Prairie Ave
- 10437 S Eberhart Ave
- 10804 S Eberhart Ave
- 10808 S Eberhart Ave
- 10810 S Eberhart Ave
- 10756 S Eberhart Ave
- 10814 S Eberhart Ave
- 10754 S Eberhart Ave
- 10801 S Vernon Ave
- 10805 S Vernon Ave
- 10816 S Eberhart Ave
- 10807 S Vernon Ave
- 10811 S Vernon Ave
- 10759 S Vernon Ave
- 10820 S Eberhart Ave
- 10813 S Vernon Ave
- 10801 S Eberhart Ave
- 10805 S Eberhart Ave
- 10755 S Vernon Ave
- 10748 S Eberhart Ave
- 10748 S Eberhart Ave
- 10817 S Vernon Ave
Your Personal Tour Guide
Ask me questions while you tour the home.