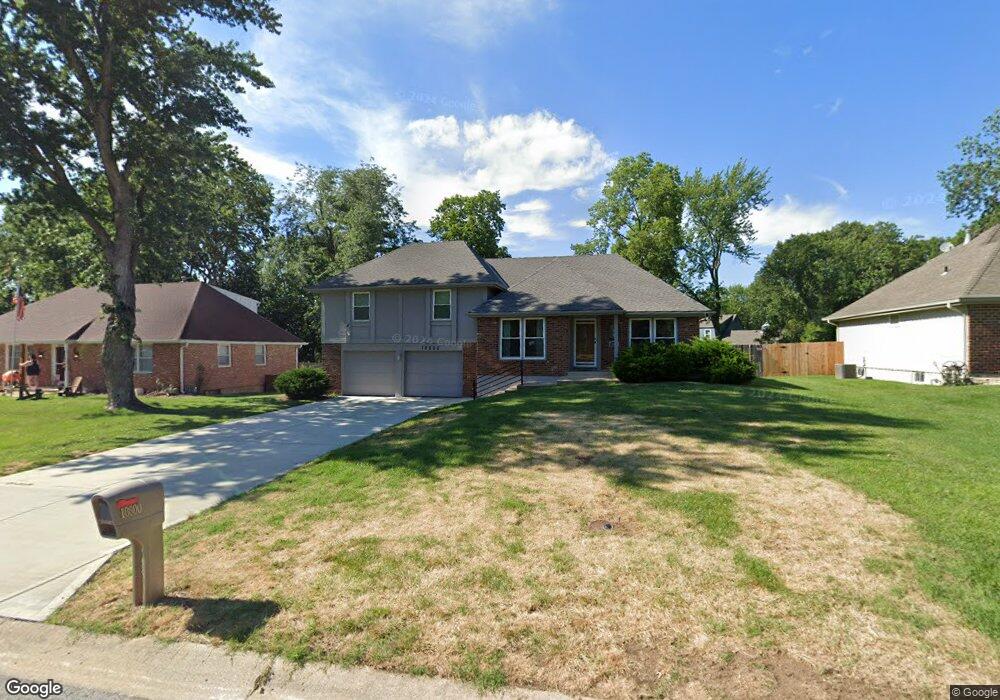
10800 W 54th St Shawnee, KS 66203
Estimated Value: $386,865 - $406,000
4
Beds
3
Baths
2,081
Sq Ft
$191/Sq Ft
Est. Value
About This Home
This home is located at 10800 W 54th St, Shawnee, KS 66203 and is currently estimated at $396,466, approximately $190 per square foot. 10800 W 54th St is a home located in Johnson County with nearby schools including Bluejacket / Flint Elementary, Hocker Grove Middle School, and Shawnee Mission North High School.
Ownership History
Date
Name
Owned For
Owner Type
Purchase Details
Closed on
Sep 12, 2011
Sold by
Nash Eddie D and Nash Claudette M
Bought by
Nash Eddie D
Current Estimated Value
Home Financials for this Owner
Home Financials are based on the most recent Mortgage that was taken out on this home.
Original Mortgage
$158,800
Interest Rate
3.89%
Mortgage Type
New Conventional
Purchase Details
Closed on
Aug 22, 2007
Sold by
Larson Lorna L
Bought by
Nash Eddie D and Nash Claudette M
Home Financials for this Owner
Home Financials are based on the most recent Mortgage that was taken out on this home.
Original Mortgage
$91,000
Interest Rate
6.7%
Mortgage Type
Credit Line Revolving
Purchase Details
Closed on
Aug 19, 2002
Sold by
Larson Lorna L
Bought by
Larson Lorna L and The Lorna L Larson Revocable Trust
Create a Home Valuation Report for This Property
The Home Valuation Report is an in-depth analysis detailing your home's value as well as a comparison with similar homes in the area
Home Values in the Area
Average Home Value in this Area
Purchase History
| Date | Buyer | Sale Price | Title Company |
|---|---|---|---|
| Nash Eddie D | -- | None Available | |
| Nash Eddie D | $180,000 | Cbkc Title & Escrow Llc | |
| Larson Lorna L | -- | -- |
Source: Public Records
Mortgage History
| Date | Status | Borrower | Loan Amount |
|---|---|---|---|
| Previous Owner | Nash Eddie D | $158,800 | |
| Previous Owner | Nash Eddie D | $91,000 | |
| Previous Owner | Nash Eddie D | $80,000 |
Source: Public Records
Tax History Compared to Growth
Tax History
| Year | Tax Paid | Tax Assessment Tax Assessment Total Assessment is a certain percentage of the fair market value that is determined by local assessors to be the total taxable value of land and additions on the property. | Land | Improvement |
|---|---|---|---|---|
| 2024 | $4,024 | $38,076 | $7,270 | $30,806 |
| 2023 | $4,105 | $38,284 | $6,624 | $31,660 |
| 2022 | $3,649 | $33,925 | $6,021 | $27,904 |
| 2021 | $3,649 | $31,487 | $5,235 | $26,252 |
| 2020 | $3,323 | $28,589 | $4,756 | $23,833 |
| 2019 | $3,243 | $27,876 | $4,534 | $23,342 |
| 2018 | $3,101 | $26,553 | $4,534 | $22,019 |
| 2017 | $2,943 | $24,794 | $4,117 | $20,677 |
| 2016 | $2,750 | $22,862 | $4,117 | $18,745 |
| 2015 | $2,451 | $21,183 | $4,117 | $17,066 |
| 2013 | -- | $19,608 | $4,117 | $15,491 |
Source: Public Records
Map
Nearby Homes
- 11002 W 55th Terrace
- Ashwood Plan at Bristol Highlands - North
- The Fleetwood Plan at Bristol Highlands - The Villas
- Cypress II Plan at Bristol Highlands - North
- The Fleetwood Plan at Bristol Highlands - The Manors
- The Brentwood Plan at Bristol Highlands - The Villas
- Yorkshire V Plan at Bristol Highlands - North
- The Kirkwood Plan at Bristol Highlands - The Villas
- 8013 Payne St
- The Rockwood Plan at Bristol Highlands - The Villas
- Magnolia Plan at Bristol Highlands - North
- 5308 Mcanany Dr
- 10116 W 52nd Terrace
- 11403 W 51st Terrace
- 10511 W 49th Place
- 9929 W 52nd St
- 9719 W 53rd St
- 11815 W 53rd St
- 0 W 49th St
- 10103 Johnson Dr
- 10712 W 54th St
- 10806 W 54th St
- 10711 W 53rd St
- 10812 W 54th St
- 10706 W 54th St
- 10801 W 54th St
- 10711 W 54th St
- 10707 W 53rd St
- 10807 W 52nd Cir
- 10816 W 54th St
- 10815 W 54th St
- 10700 W 54th St
- 5406 Ballentine St
- 10707 W 54th St
- 10715 W 53rd St
- 5407 Ballentine St
- 10701 W 53rd St
- 5407 Bluejacket St
- 10900 W 54th St
- 10817 W 52nd Cir