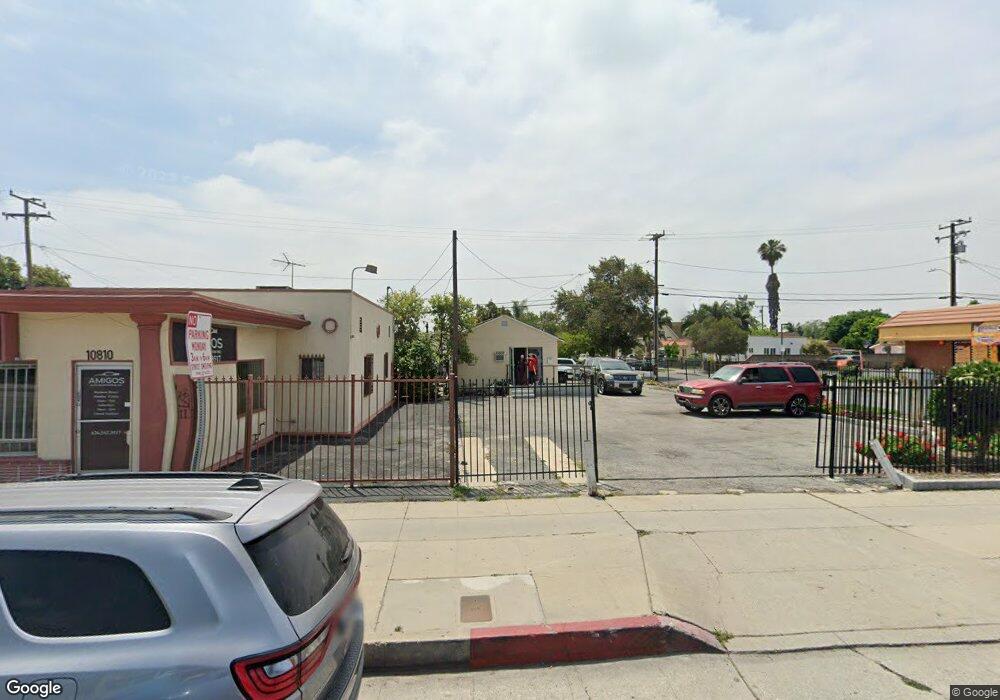
10802 Garvey Ave El Monte, CA 91733
Mountain View NeighborhoodEstimated Value: $424,441
--
Bed
--
Bath
378
Sq Ft
$1,123/Sq Ft
Est. Value
About This Home
This home is located at 10802 Garvey Ave, El Monte, CA 91733 and is currently estimated at $424,441, approximately $1,122 per square foot. 10802 Garvey Ave is a home located in Los Angeles County with nearby schools including Wilkerson Elementary School, Columbia School, and El Monte High School.
Ownership History
Date
Name
Owned For
Owner Type
Purchase Details
Closed on
Feb 22, 2022
Sold by
Lai Lydia Hisn-Chun
Bought by
Lai Chia Hung
Current Estimated Value
Purchase Details
Closed on
Aug 28, 2017
Sold by
Cao Rujun
Bought by
Kawo Intl Inc
Home Financials for this Owner
Home Financials are based on the most recent Mortgage that was taken out on this home.
Original Mortgage
$165,000
Interest Rate
3.86%
Mortgage Type
Commercial
Purchase Details
Closed on
Oct 25, 2016
Sold by
Boswell Bruce R
Bought by
Cao Rujun and Liu Haiping
Purchase Details
Closed on
Mar 22, 2016
Sold by
Boswell Michael K
Bought by
Boswell Michael K and Michael K Boswell Family Trust
Purchase Details
Closed on
Jan 8, 2005
Sold by
Boswell Keith R and Keith & Myrtle Boswell 1988 Tr
Bought by
Boswell Keith R and Keith & Myrtle Boswell 1988 Trust A
Create a Home Valuation Report for This Property
The Home Valuation Report is an in-depth analysis detailing your home's value as well as a comparison with similar homes in the area
Home Values in the Area
Average Home Value in this Area
Purchase History
| Date | Buyer | Sale Price | Title Company |
|---|---|---|---|
| Lai Chia Hung | -- | Lawyers Title | |
| Kawo Intl Inc | $330,000 | Wfg Title Company Of Ca | |
| Cao Rujun | $2,750,000 | First American Title Ins Co | |
| Boswell Michael K | -- | None Available | |
| Boswell Bruce R | -- | None Available | |
| Boswell Bruce R | -- | None Available | |
| Boswell Keith R | -- | -- |
Source: Public Records
Mortgage History
| Date | Status | Borrower | Loan Amount |
|---|---|---|---|
| Previous Owner | Kawo Intl Inc | $165,000 |
Source: Public Records
Tax History Compared to Growth
Tax History
| Year | Tax Paid | Tax Assessment Tax Assessment Total Assessment is a certain percentage of the fair market value that is determined by local assessors to be the total taxable value of land and additions on the property. | Land | Improvement |
|---|---|---|---|---|
| 2025 | $5,687 | $405,379 | $382,034 | $23,345 |
| 2024 | $5,687 | $397,432 | $374,544 | $22,888 |
| 2023 | $5,574 | $389,640 | $367,200 | $22,440 |
| 2022 | $5,008 | $353,825 | $321,660 | $32,165 |
| 2021 | $5,079 | $346,888 | $315,353 | $31,535 |
| 2019 | $5,182 | $336,600 | $306,000 | $30,600 |
| 2018 | $5,032 | $330,000 | $300,000 | $30,000 |
| 2016 | $979 | $44,060 | $27,935 | $16,125 |
| 2015 | $967 | $43,399 | $27,516 | $15,883 |
| 2014 | $944 | $42,549 | $26,977 | $15,572 |
Source: Public Records
Map
Nearby Homes
- 2822 Gage Ave
- 2802 Granada Ave
- 3051 Nevada Ave
- 2723 Tyler Ave
- 10829 Elliott Ave
- 3154 Washington Ave
- 10507 Bodger St
- PLAN THREE at Brookhaven
- PLAN TWO at Brookhaven
- PLAN ONE at Brookhaven
- 3223 Washington Ave
- 3141 Santa Anita Ave E Unit C
- 3141 Santa Anita Ave E Unit A
- 3141 Santa Anita Ave E Unit F
- 3141 Santa Anita Ave E Unit E
- 3141 Santa Anita Ave E Unit D
- 3141 Santa Anita Ave E Unit B
- 10631 Mildred St
- 11131 Dodson St Unit 7
- 10327 Bodger St
- 10810 Garvey Ave
- 2816 Lexington Ave
- 2812 Lexington Ave
- 2811 Lexington Ave
- 2808 Lexington Ave
- 10803 Garvey Ave
- 10801 Garvey Ave
- 2817 Washington Ave
- 2807 Lexington Ave
- 2802 Lexington Ave
- 2811 Washington Ave
- 10813 Garvey Ave
- 2803 Lexington Ave
- 10823 Garvey Ave
- 2805 Washington Ave
- 2742 Lexington Ave
- 2818 Gage Ave
- 2812 Gage Ave
- 2741 Lexington Ave
- 2801 Washington Ave