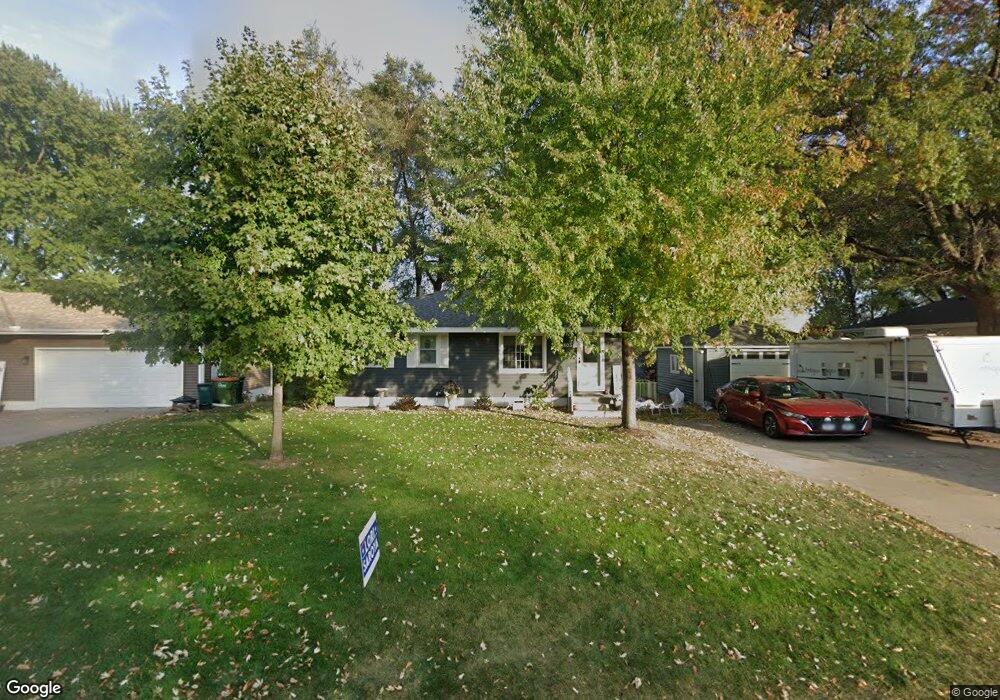
10803 Quincy Blvd NE Minneapolis, MN 55434
Estimated Value: $306,000 - $337,000
4
Beds
2
Baths
880
Sq Ft
$367/Sq Ft
Est. Value
About This Home
This home is located at 10803 Quincy Blvd NE, Minneapolis, MN 55434 and is currently estimated at $323,033, approximately $367 per square foot. 10803 Quincy Blvd NE is a home located in Anoka County with nearby schools including Madison Elementary School, Northdale Middle School, and Blaine Senior High School.
Ownership History
Date
Name
Owned For
Owner Type
Purchase Details
Closed on
Sep 1, 1994
Sold by
Purtle Howard L and Purtle Susan P
Bought by
Rogers Michelle and Rogers Dale
Current Estimated Value
Purchase Details
Closed on
Jul 25, 1985
Sold by
Fitzsimonds Don and Fitzsimonds Loretta J
Bought by
Purtle Howard L and Purtle Susan P
Create a Home Valuation Report for This Property
The Home Valuation Report is an in-depth analysis detailing your home's value as well as a comparison with similar homes in the area
Home Values in the Area
Average Home Value in this Area
Purchase History
| Date | Buyer | Sale Price | Title Company |
|---|---|---|---|
| Rogers Michelle | $74,995 | -- | |
| Purtle Howard L | $63,900 | -- |
Source: Public Records
Mortgage History
| Date | Status | Borrower | Loan Amount |
|---|---|---|---|
| Closed | Purtle Howard L | -- | |
| Closed | Purtle Howard L | $44,000 |
Source: Public Records
Tax History Compared to Growth
Tax History
| Year | Tax Paid | Tax Assessment Tax Assessment Total Assessment is a certain percentage of the fair market value that is determined by local assessors to be the total taxable value of land and additions on the property. | Land | Improvement |
|---|---|---|---|---|
| 2025 | $2,820 | $286,800 | $110,000 | $176,800 |
| 2024 | $2,820 | $279,400 | $108,200 | $171,200 |
| 2023 | $2,498 | $272,900 | $100,000 | $172,900 |
| 2022 | $2,285 | $269,400 | $86,400 | $183,000 |
| 2021 | $2,223 | $222,100 | $75,000 | $147,100 |
| 2020 | $2,190 | $212,100 | $73,000 | $139,100 |
| 2019 | $2,028 | $202,200 | $68,300 | $133,900 |
| 2018 | $1,910 | $185,200 | $0 | $0 |
| 2017 | $1,663 | $172,100 | $0 | $0 |
| 2016 | $1,673 | $150,500 | $0 | $0 |
| 2015 | $1,611 | $150,500 | $55,500 | $95,000 |
| 2014 | -- | $128,400 | $45,000 | $83,400 |
Source: Public Records
Map
Nearby Homes
- 10721 Quincy Blvd NE
- 714 114th Ct NE
- 10809 Tyler Ct NE
- 612 111th Ave NE
- 11038 Polk St NE
- 10753 Tyler Ct NE
- 1060 109th Ct NE
- 11119 Jefferson St NE
- 11150 Jefferson St NE
- 11213 Fillmore St NE
- 10701 6th St NE
- 866 113th Ln NE
- 961 113th Ave NE
- 127 111th Square NE Unit 148
- 11205 112th Square NE Unit 163
- 11220 7th St NE
- 10570 President Dr NE
- 126 112th Square NE Unit 159
- 10913 4th St NE
- 11213 112th Square NE Unit 165
- 10809 Quincy Blvd NE
- 10725 Quincy Blvd NE
- 10815 Quincy Blvd NE
- 10808 Quincy Blvd NE
- 10802 Quincy Blvd NE
- 10724 Quincy Blvd NE
- 10814 Quincy Blvd NE
- 10854 Able St NE
- 10848 Able St NE
- 10715 Quincy Blvd NE
- 10720 Quincy Blvd NE
- 724 109th Ave NE
- 10844 Able St NE
- 10714 Quincy Blvd NE
- 10868 Able St NE
- 10840 Able St NE
- 10805 Monroe Dr NE
- 10809 Monroe Dr NE
- 10708 Quincy Blvd NE
- 10719 Monroe Dr NE